Blog

Escaping the Packed Elevator in PostgreSQL: How to Tackle Connection Pool Saturation
Aug 10, 2024
Alright, picture this: It's the middle of a busy weekend. Your online store is buzzing with activity. All of a sudden, the shopping cart application grinds to a halt. The dreaded moment every SRE and DevOps pro fears has arrived: Connection Saturation in your PostgreSQL database. Yes, your database has suddenly turned into a packed elevator where no one can get in or out. Don't worry; you're not alone. This is a very "connectable" problem many face (see what I did there?). In this blog, we'll go through a no-nonsense, step-by-step guide on how to troubleshoot and fix this issue. ## **What's the Deal with Connection Saturation Anyway?** In the context of PostgreSQL databases, the term "connection saturation" refers to the scenario where the number of active database connections is dangerously close to or has reached the maximum limit set in the PostgreSQL configuration. Typically, this limit is set of 100 by default, and experts suggest that anywhere aboue 70-85 connections is a bad place to be. Imagine trying to join a Zoom call that's already at its 100-person limit; it's the same story but with your database! ## **Lights, Camera, Action: The Runbook** Let's put on our SRE hats and go through a hypothetical runbook designed to troubleshoot and remedy this situation. We'll focus on a demo involving a `shopping_cart` application backed by a PostgreSQL database. ### **1. First Thing's First: How Crowded is the Elevator?** The first step is to find out how many active connections we have. Let's connect to our database and count them. ```python import psycopg2 # Database connection details connection = psycopg2.connect( dbname='shopping_cart_db', user='admin', password='password123', host='shopping-cart-db-host', port='5432' ) # Execute the query cursor = connection.cursor() cursor.execute('SELECT count(*) FROM pg_stat_activity;') active_connections = cursor.fetchone()[0] cursor.close() connection.close() # Print the result active_connections ``` And the output? A staggering `99`. With a default limit of 100, we're standing on very thin ice here, my friends! ### **2. Let's Get Those Numbers Down: Remediation Time!** #### Increasing the Party Size 🎉 A quick fix could be to increase the `max_connections` setting in your `postgresql.conf` file. Here's a Python script that can help you make this change. ```python import os # Point to your postgresql.conf config_path = "/path/to/postgresql.conf" def increase_max_connections(new_limit): with open(config_path, 'r') as file: content = file.readlines() for idx, line in enumerate(content): if line.startswith('max_connections'): content[idx] = f"max_connections = {new_limit}\n" break else: content.append(f"max_connections = {new_limit}\n") with open(config_path, 'w') as file: file.writelines(content) ``` Remember to restart your PostgreSQL service after this. ```sh sudo systemctl restart postgresql ``` ### **3. The Proof is in the Pudding: Post-Remediation Checks** Let's re-run our script to check the active connections. ```sh # ... (same code as before) active_connections_post_remediation ``` Voila! The number goes down to `30`. We've got room to breathe, and more importantly, room for more connections! ## **Wrapping Up** And there you have it—a practical guide on troubleshooting and fixing a connection saturation issue in your PostgreSQL-backed shopping cart app. The next time your database decides to throw a "connection party," you'll not only be the life of the party, but you'll also know how to gracefully kick people out (or let more in, in this case). Remember, database management is a lot like hosting a party: It's all fun and games until someone overstays their welcome. Keep an eye on your resources, and you'll keep the party going!

One Person's pebble is another person's boulder
Aug 10, 2024
Earlier this week, I ran across this article about how a local lighthouse's power cable to the mainland has snapped:  In the article, they mention that the underwater cable had snapped with "no notice." This got me thinking about how a simple issue (like a power outage) can affect different people in enormously different ways. Whenever my house loses power, a truck is dispatched to repair the line. It is rare to have an outage that lasts more than an hour or so, but every now and then we lose power overnight. Some of our neighbors, who require a regular power source, have added generators. Their outages are typically just a long enough blink that they have to reset the clock on the microwave. Our neighbors on the island? They are using kerosene lanterns, and living without power, as they figure out how to raise the $500,000 to lay another cable. In the grand scheme of things, my family is in the comfortable middle - we can deal with a power outage for a couple of hours (or a day at the worst), while the island is the 99.999th percentile outlier - month 9 of no electricity. # AWS's us-east-1 outage This week, AWS had an outage in their us-east-1 data center. us-east-1 is leaned on by thousands of companies that are household names. Gergely Orosz has a great summary Tweet where he breaks down some of the companies affected: [ https://twitter.com/GergelyOrosz/status/1669375456859021313 ]( https://twitter.com/GergelyOrosz/status/1669375456859021313 ) Again, some companies were 100% degraded due to the outage. Some had major features impacted, and some lost features, but were still up. While, everyone was affected differently, and the outage was bad - everything came back online within a few hours. Even so, there were probably teams ready to switch to a new datacenter if the issue were to not resolve itself in a reasonable amount of time. Luckily, this was not a 99.999% outlier for storing your data in the cloud. This has happened! In 2021, OVH's Strasbourg datacenter caught on fire, and all data was lost:  # For me a pebble, for you a boulder As SREs and DevOps professionals, we are often planning for outage scenarios - both the "power flicker" that is a minor inconvenience, but also the "datacenter has burned down" - time to rebuild everything from our backups we have saved in another region. Having Runbooks that can run automatically when a small issue appears alleviates the "death by a thousand pebbles" that can lead to burnout for your team. Having RunBooks to handle your disaster recovery plan are also critical, because if your datacenter is on fire - tension will be at 1000%, and the pressure to get everything "back to normal" will be insane. RunBooks with an outlined procedure will make this process much easier. # Conclusion We all have technical debt in our systems, and we all know that they will come to bite us at some point. The lighthouse keepers knew the cable would fail (it was well over it's expected lifetime!), and had done research into solar and alternative power, but since they had not acted on the plan - are still dealing with an outage. In the tech world, the analogy might be a Microsoft 2003 server lurking in a back office somewhere - don't touch it... it just works. But it is important to be ready - that server *will* fail. Your datacenter will go down. When that happens, what will you do? If you're looking for a runbook automation system - check out unSkript. We have hundreds of open source Actions and RunBooks ready for you to start building in minutes! Try us in the [cloud](https://us.app.unskript.io/xRunBooks), or run it locally in [Docker](http://runbooks.sh). Feel free to ask us questions on [Slack](https://communityinviter.com/apps/cloud-ops-community/awesome-cloud-automation), or your social media platform of choice! Of course, a discussion about boulders and pebbles requires a link to this classic meme: [ https://twitter.com/SheriffAlert/status/1221881862244749315 ]( https://twitter.com/SheriffAlert/status/1221881862244749315 )

Navigating the Labyrinth: The Complexities of Supporting Self-Hosted Instances for Customers
Jul 7, 2024
Self-hosting is a concept that has garnered significant attention in recent years. The ability for customers to manage their own services, applications, or platforms offers enticing advantages such as greater control, customization, cost reduction, and enhanced privacy. However, with the decision to support self-hosted instances for customers, organizations invite a set of complexities that can present challenges and require careful handling. In this blog post, we will navigate through these complexities, shedding light on the potential hurdles and offering strategies to mitigate them. ### Diverse Technical Environments Perhaps the most apparent complexity of supporting self-hosted instances arises from the vast diversity of technical environments. Each customer's IT infrastructure can be unique, featuring different combinations of hardware, operating systems, network configurations, security policies, and more. This heterogeneity can make it challenging to ensure that your product operates consistently and efficiently across all possible environments. This can also add complexities to troubleshooting when problems arise, as issues could stem from any number of unique configuration scenarios. ### Varied Skill Levels and IT Resources Another challenge when supporting self-hosted instances is the wide range of technical skill levels and resources among your customer base. Some customers may have a robust IT team capable of troubleshooting complex issues with something like Kubernetes, while others might rely solely on your support for even minor technical hiccups. ### Frequent Software Updates and Patches Supporting self-hosted instances often means ensuring that customers stay updated with the latest software patches or updates, which can pose a challenge. This can become more complex if customers have customized your product or if updates require significant system resources or downtime. ### Disaster Recovery and Data Backup Lastly, self-hosting shifts the responsibility of data backup and disaster recovery to the customer. Ensuring customers have effective backup and recovery strategies can be complex, particularly when considering diverse technical environments and customer IT resources. ### Solution: Apply an SRE Mindset unSkript offers a unique solution to companies, both large and small, that are struggling to support customers that are self hosting their software. By using similar concepts that are used by SRE and production operations teams to service and maintain very large SaaS environments, unSkript has created a series of pre-built runbooks that can be embedded directly into software that is going to be deployed in a self hosted environment. By integrating these runbooks directly into the self-hosted product, software companies can promote a self-reliant, customer-focused experience that empowers customers to proactively identify, diagnose, and solve issues, thus eliminating the need for additional support. Supporting self-hosted instances for customers might appear a complex endeavor. However, with unSkript, companies can pave the way for seamless, secure, and user-friendly self-hosting experiences that shifts the narrative from managing complexities to harnessing opportunities.

Minimizing AWS Costs: Eliminating Idle Elastic Load Balancers
Jun 2, 2024
In the ever-evolving world of cloud computing, optimizing costs is a top priority for organizations leveraging AWS. While AWS offers a wide range of powerful services, idle or unused resources can quickly become a financial burden. One often overlooked area for cost optimization is AWS Elastic Load Balancers (ELB). These crucial components play a vital role in distributing traffic and ensuring high availability for applications. However, Load Balancers that have no targets, such as inactive or deprecated resources, can contribute to unnecessary [costs](https://aws.amazon.com/elasticloadbalancing/pricing/) over time. Using the AWS Pricing Calculator, for a single Application Load Balancer that processes 1 GB per hour per ALB for Lambda functions as targets and 1 GB per hour per EC2 Instances and IP addresses as targets, it costs 44.24 USD per month which is 530.88 USD yearly (_assuming the region as us-west-2_). As mentioned in the [cost optimization user guide](https://docs.aws.amazon.com/awssupport/latest/user/cost-optimization-checks.html) by AWS, finding idle load balancers is a listed check and needs to be implemented as a crucial step towards cost optimization and improved financial efficiency. ## How to find AWS Load Balancers without targets? AWS offers various types of Load Balancers, including Classic Load Balancer (CLB), Network Load Balancer (NLB), and Application Load Balancer (ALB). Load Balancers act as a traffic distribution mechanism, routing incoming requests to multiple resources, such as EC2 instances or containers. However, as infrastructure needs change over time, certain Load Balancers may become obsolete or remain idle, continuing to incur costs. AWS ELBv2 load balancers (NLB or ALB) are considered as idle or unused when the target group associated with them has no EC2 instances attached or when the attached target instances are unhealthy. Although classic load balancers (ELB) are deprecated now, they too should be checked for unhealthy target instances. While the manual identification process can help you identify Load Balancers with no targets, it's important to note that it can be slow and repetitive, particularly if you have a complex AWS environment spread across multiple regions. We will look at a solution to automate this process later in this article. To identify Load Balancers with no targets from the AWS Management Console follow these steps: 1. Sign in to the AWS Management Console. 2. Navigate to the EC2 service. 3. In the EC2 Dashboard, locate the "Load Balancing" section in the left-hand menu and click on "Load Balancers" 4. On the Load Balancers page, you will see a list of all your load balancers in the selected region. 5. Review the list of load balancers and identify any load balancers that you suspect may be unused. 6. To determine if a load balancer is being used, you can click on the load balancer's name to view its details. 7. In the load balancer details, go to the "Instances" tab. This tab will show you the instances that are currently registered with the load balancer. For NLB’s check if there are no ports attached. 8. If there are no instances/ports listed or if the instances listed are not actively running, it is an indication that the load balancer might be unused. 9. Repeat the process for each load balancer in the list to identify any unused ones. To do the same using AWS CLI follow these steps: 1. Open a terminal or command prompt and run the following command to list all the load balancers in your AWS account: ```sh aws elbv2 describe-load-balancers ``` This command will return a JSON response with information about all the load balancers in the selected region. 2. Review the list of load balancers and identify the ones that you suspect may be unused by checking each load balancer if there are any instances registered with it. 3. Run the following command to list the registered targets for a specific load balancer: ```sh aws elbv2 describe-target-health --target-group-arn <target_group_arn> ``` 4. The command will provide a JSON response with information about the health status of the targets registered with the load balancer. 5. Analyze the output of the command in step 4. If there are no targets listed or if the targets are not in a healthy state, it indicates that the load balancer might be unused. 6. Repeat steps 4 and 5 for each load balancer in the list to identify any unused ones. ## unSkript's way of optimizing ELB costs Notice how we have to repeat these steps for all the load balancers. The process can be time-consuming and error-prone, especially in environments with numerous Elastic Load Balancers. Manually reviewing each Load Balancer's configuration and checking for associated targets can lead to oversights and potential wastage of resources.** **To streamline the identification and deletion of idle Load Balancers, UnSkript provides a runbook- [Delete AWS ELBs with no targets or instances](https://github.com/unskript/Awesome-CloudOps-Automation/blob/master/AWS/AWS_Delete_ELBs_With_No_Targets_Or_Instances.ipynb) that automates the steps involved in identifying and removing Load Balancers of all types without any targets. By leveraging this runbook, organizations can save time, reduce costs, and enhance their AWS infrastructure management. You can try it out on our open-source [runbooks.sh](https://unskript.github.io/Awesome-CloudOps-Automation/) repository on Github. 

What are RunBooks, and Why Should I Automate them
May 11, 2024
What is a RunBook, why are notebooks the best format for RunBooks and why does unSkript think the future of RunBooks is automation? In this post, we'll cover what a RunBook is, advantages of the notebook format for runbooks and how automation is the logical next step for RunBook execution. # What is a RunBook? Let's kick off this discussion with a definition. [Wikipedia](https://en.wikipedia.org/wiki/Runbook) defines a RunBook in the following way: > A runbook is a compilation of routine procedures and operations that the system administrator or operator carries out. System administrators in IT departments and NOCs use runbooks as a reference. So RunBooks are checklists or procedures that technical teams use to carry out tasks. Other online definitions point out the RunBooks are often used on repetitive tasks and to improve standardization. Basically, if everyone follows the same steps for common tasks, the outcomes will always be the same. # RunBook Advantages * **When there is an issue**: When things are broken, stress levels are high. Having an ordered checklist breaking down the steps that must be taken to remediate the problem lowers the stress of the situation, and lowers the time to resolution. * **Training**: When onboarding a new member to the team, you can use your RunBooks as training guides on how to create, rebuild and fix parts of the cloud infra. * **Collaboration**: Learn from other RunBooks, re-use, repurpose and extend the team's RunBooks for additional purposes. * **Reduced Escalation**: If your NOC or on-call engineer can execute the RunBook - they may resolve the issue without escalating to the team. # RunBook formats A group of elephants is a herd and a flock of flamingos is called a flamboyance. When you have a grouping of RunBooks, it is called a playbook. When there is a task to be taken care of, the team can reach for (probably virtually) the playbook, find the correct RunBook, and execute the task. Many companies use Wikis for their playbook. Wikis meet much of the criteria for a RunBook - online, collaborative. The biggest downside to a wiki based runbook is that there is no way to execute any code inside the wiki page, meaning at least 2 or three windows must be open at once to complete the RunBook. We at unSkript believe that the Jupyter Notebook format is a better way to create and use Runbooks, and we have extended the concept of notebooks to make them even better. There are a number of reasons: 1. The Notebook format takes small code snippets and combines them into a full running application. This is ideal for a RunBook, as each step can be covered in a Notebook cell, and the entire RunBook is completed when the notebook is completed. 2. Notebooks have markdown sections that are not run as code. This is perfect for commenting and describing each step in the runbook. Sections that are *not automated yet* can be described in these sections. 3. Since the fix is the code - the RunBook will be updated when changes are made. Where the unSkript format of Jupyter Notebooks push the format ahead: 1. unSkript's Notebook format handles credentials in a secure fashion - no more leaving variables with your credentials in the notebook! (Did I just push them to Github?) 2. Reuse of steps across Notebooks is not easy by default. in unSkript, steps (called Actions) are easily added from a library of actions. # Why Should I Automate RunBooks? RunBooks as guides or checklists can give your team the tools to deploy infrastructure, remediate outages and more - but should we automate them? Sure! Here are a few benefits to automating your RunBooks: * **Lower Time To Resolution**: Computers are good at doing repetitive things, and complete tasks faster than a human could: so the issue will be resolved faster than manually completing the tasks. * **Reduce errors**: Automation will precisely complete the task at hand, without the possibility of human error. * **Reduce manual tasks (toil)**: Many manual provisioning/creation tasks are performed on a regular schedule, and take significant time out of the day. By automating these tasks, you can reserve that time for other work. # How do RunBooks Work? As described above, RunBooks are a type of checklist - a series of steps, that when performed in order, will complete a desired task. Another term that is commonly used is a workflow. And when building an automated RunBook, that is term that describes the process well. Here are the basic steps to build (or execute) a RunBook: 1. **Start with Inputs.** You have some known parameters to feed into the RunBook, so create input parameters for these values. They can then be used during the steps of the workflow/RunBook to create your desired outcome. 2. **Build Action Steps**: Build on your input parameters. Make queries into your infrastructure based on the inputs to gain more knowledge or information. Take that gained information and build on it to reach your desired outcome. * RunBooks can have as many steps as you need to complete the task. With unSkript's drag & drop interface, you can easily search for [Actions](https://docs.unskript.com/unskript-product-documentation/guides/action_list) , drag them into the RunBook, and the configure the input/output variables. * Need to skip a step? unSkript's [Start Condition](https://docs.unskript.com/unskript-product-documentation/guides/actions/action-configuration/action-start-condition) can skip a step if certain conditions are met. * Actions can be used to identify, and then remediate an issue. > With unSkript, Actions are completed in order, and do not loop. From a workflow perspective, RunBooks work as a Directed Acyclic Graph (DAG). Directed - one direction only. Acyclic - no looping. 3. Output: Your RunBook will output the variables you request as an output. Additionally, add Actions like *Send a Message to Slack* for additional notifications. When fully automated, RunBooks behave similarly to a workflow. Inputs are transformed and used to gain more information and can even fix the issue automatically. # How can I automate Runbook Execution? In many of our [posts](https://unskript.com/blogs) and [videos](https://www.youtube.com/@unskript), we show an interactive walkthrough of a RunBook - explaining how each Action works, and how all of the Actions connect together. But you can programmatically run each RunBook to further your automation. * **[Scheduled runs](https://docs.unskript.com/unskript-product-documentation/guides/xrunbooks/schedules)**: Collect data. run healthchecks on a schedule. Just configure the schedule in the UI, adn run your RunBook hourly, daily, weekly - it's your call! * **[API call](https://docs.unskript.com/unskript-product-documentation/api-reference0)**: Use your API token, and send the input parameters via a REST call. * **[Alarm](https://docs.unskript.com/unskript-product-documentation/guides/xrunbooks/alarms)**: If your infrastructure fires an alarm - have a RunBook execute automatically to remediate the situation. # unSkript in Action With unSkript, since all of your automated RunBooks are online, there is a search mechanism built into your playbook collection. The team can just search for the RunBook needed, and execute it. With unSkript's Resource Based Access Control, different teams can have different levels of access - some RunBooks may be privileged, and only accessed by a few. Some may require an authorization request to be run, and this is also built into unSkript. # Conclusion RunBooks are a way for DevOps and SRE teams to create reproducible procedures that keep the technology stack going. Having a playbook of RunBooks means that your teams will be prepared for many common tasks and outages. By automating your RunBooks, you further extend the power of RunBooks and simplify the day to day operations of your Cloud. Interested in learning more about how unSkript can help you automate RunBooks? Check out our [docs](https://docs.unskript.com). If you're ready to jump in and try it out, we have an [open source Docker image](https://github.com/unskript/Awesome-CloudOps-Automation), and a [free cloud trial](https://us.app.unskript.io/) with dozens of free RunBooks and hundreds of drag and drop actions ready to be wired together into a Runbook.

Manage your unused AWS Nat Gateways with unSkript
May 5, 2024
As someone who is trying to learn as much about the cloud as I can, I like listening to podcasts that discuss interesting facets of cloud computing. One of my regular weekly podcasts is [Screaming in the Cloud](https://www.lastweekinaws.com/podcast/screaming-in-the-cloud/) featuring [Corey Quinn](https://twitter.com/QuinnyPig). Corey's company works to reduce AWS bills for customers - which is a business with a *lot* of potential customers. In his podcast, Corey often makes fun of AWS Managed NAT Gateways. Just from the title of his blog post, you can get the gist: [The AWS Managed NAT Gateway is Unpleasant and Not Recommended](https://www.lastweekinaws.com/blog/the-aws-managed-nat-gateway-is-unpleasant-and-not-recommended/) - but of course you can click the link to read more. Corey's main issue is that NAT Gateways at AWS are **EXPENSIVE**. You have to pay for each hour that you have a Nat Gateway up ($0.045/hour), and then also pay for data throughput. > **Math Fun** 4.5 cents an hour -> That's $1.08/day. or $394 a year per NAT Gateway. Corey is right on the nose with this one. NAT Gateways (even before you send any data) are expensive to operate. ## Managing your NAT Gateways It is really easy to start up a NAT Gateway, and...it is just as easy to forget to turn off up a NAT Gateway when you are finished using it. At unSkript, we are building automation RunBooks to help you understand, automate and remediate your Cloud Operations. Many of our customers are cactively looking to control their cloud costs, so we've been creating RunBooks to do that. To that end, we have created the [Delete Unused AWS NAT Gateways](https://github.com/unskript/Awesome-CloudOps-Automation/blob/master/AWS/Delete_Unused_AWS_NAT_Gateways.ipynb) RunBook. It is included in all versions of unSkript, including our open source [Docker Install](https://github.com/unskript/Awesome-CloudOps-Automation) and the [Free Trial](https://us.app.unskript.io/) of our Cloud product. ## How it works This RunBook requires no input parameters. By default, it will scan all AWS regions for NAT Gateways that have been unused for the last 7 days. (You can specify a region, or change the threshold through the inputs, if desired). [](https://youtu.be/Dm6REaFUWpY) From there, the steps are pretty logical: 1. Create a list of the regions from the input, or get all the AWS regions. 2. Loop through all of the regions, and create a list of all NAT Gateways that have no usage for the defined period and parse the AWS output into a List. 3. Delete the unused NAT Gateways. ## See it in Action I'm a big fan of dogfooding the tools we build, so I ran this RunBook against the unSkript dev environment. Before I ran it, I seeded a NAT Gateway into `us-west-2` that could be removed by the RunBook. Imagine my surprise, when the RunBook suggested deleting **THREE** NAT Gateways! 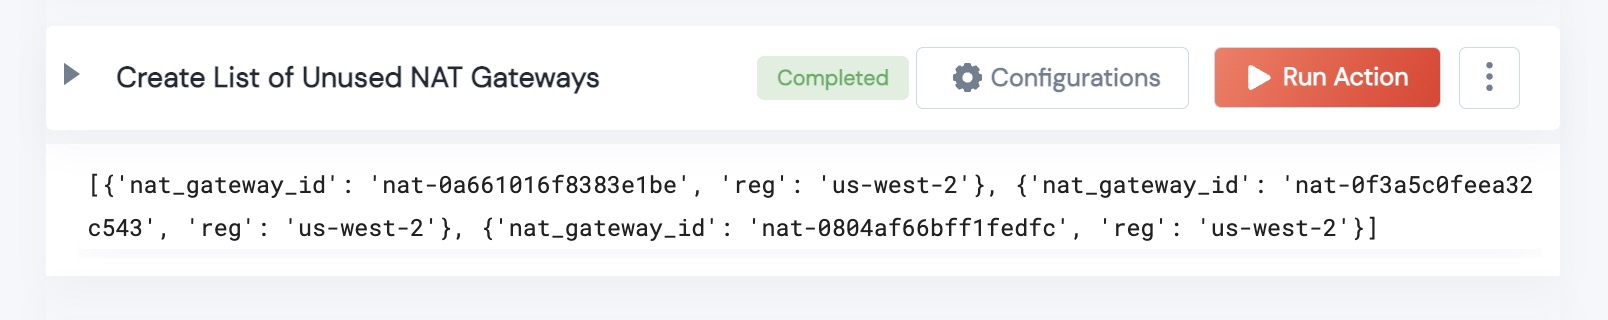 ...that can't be right....logs into the AWS console and :facepalm: Yeah. We had 2 unused NAT Gateways just sitting in dev. Ugh. Lucky, the next step is to take the Gateway IDs and schedule them for deletion. Looking in the AWS Console, we can see that the RunBook has completed its job: 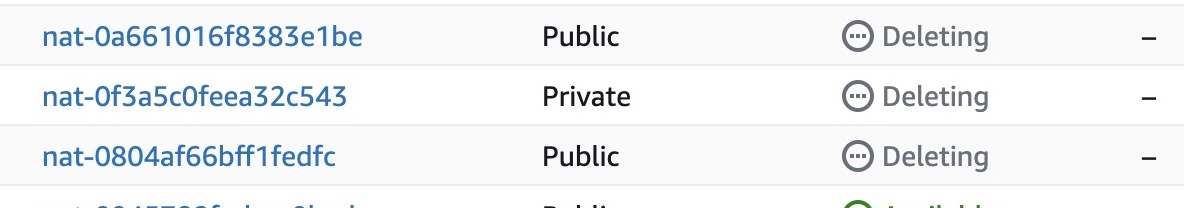 ## The glass is half full While it is frustrating that these NAT gateways were sitting unused, they could have lurked in our account for months longer without this RunBook. By running this automation, they will no longer contribute to our AWS spend. ## How about YOUR AWS account? If our AWS Account had lingering unused NAT Gateways - it is entirely possible that your AWS environments do as well. Why not give unSkript a try - either our [Open Source](https://github.com/unskript/Awesome-CloudOps-Automation) or our Cloud online [free trial](https://us.app.unskript.io/). The RunBook is pre-installed - so search for "Delete Unused AWS NAT Gateways." Open the RunBook, add your AWS credentials, and you can find all of your unattached NAT Gateways and remove them!

Cost Optimization EC2 Instance Lifetime Management
Mar 23, 2024
## EC2 Instance Lifetime Management to Target Cost Optimization There are a plethora of reasons to c;osely monitor how your team is using the cloud, but one of the most compelling reasons is to realize cost savings. You will also find that working with your team to optimize your resource sizing will also improve the efficiency of the infrastructure and better resource management which will thereby increase scalability of the infrastructure as needed. As reported in the State of the Cloud report by Flexera, 62% of companies are allocating time and energy to optimize their cloud infrastructure costs. This is not terribly surprising, as the current financial climate has companies looking to save money in many ways. 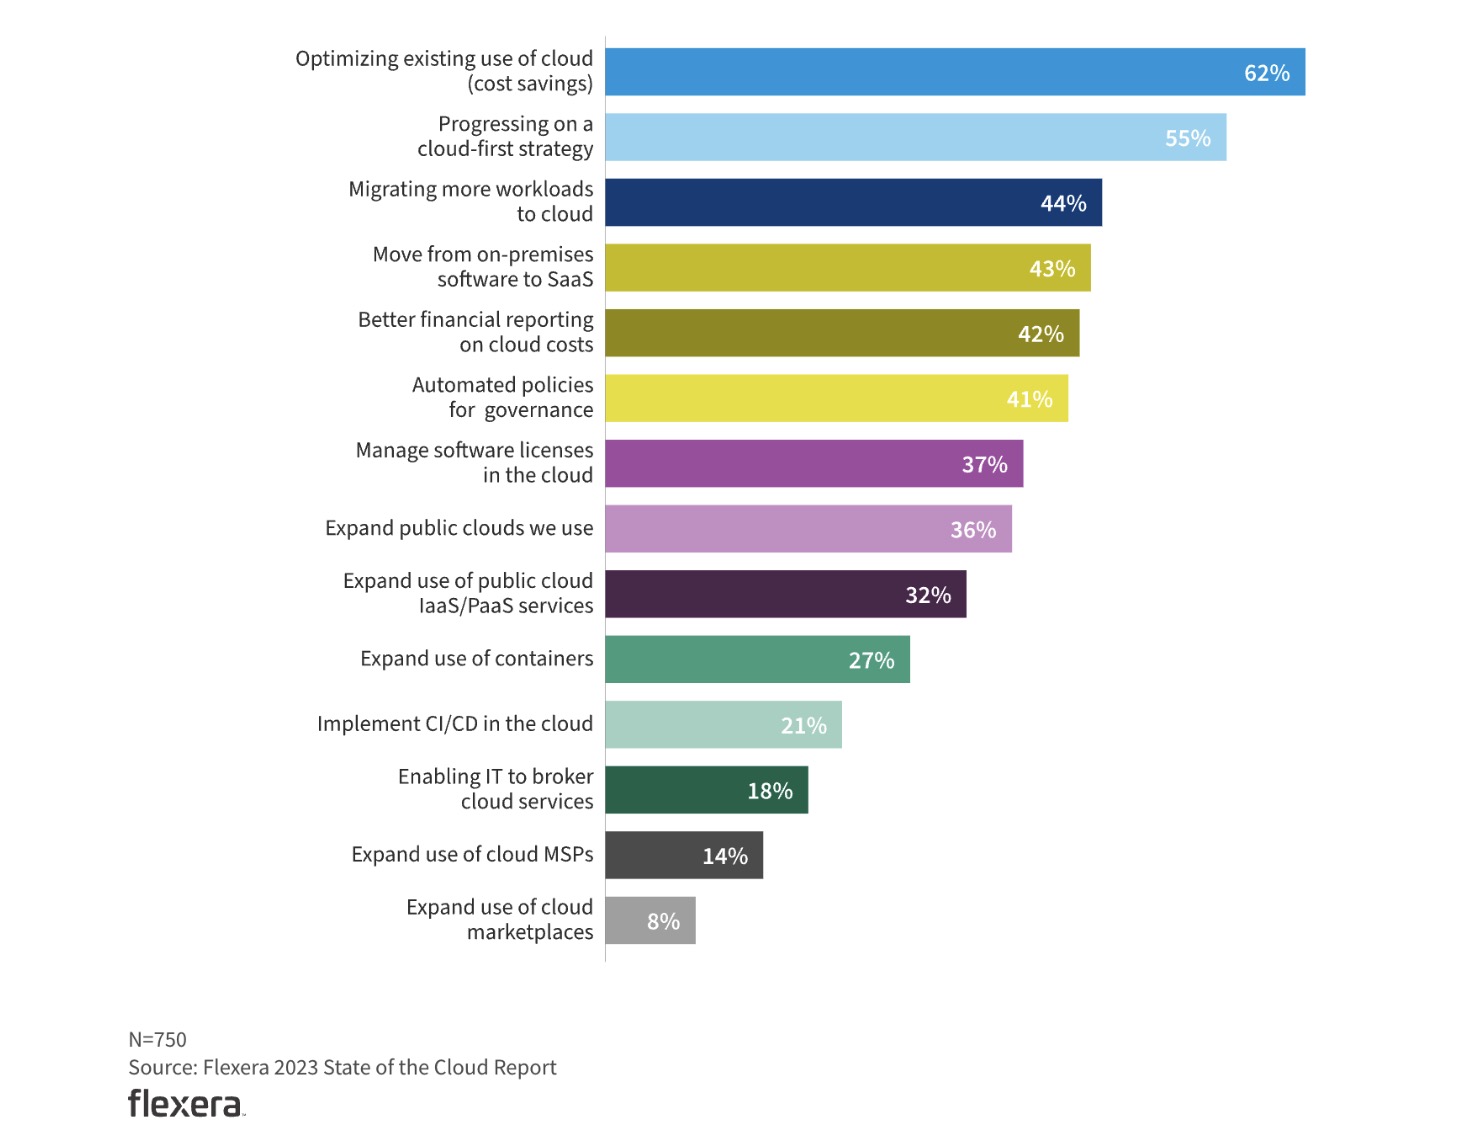 To plan out ‘how’ to reduce costs, we first need to know ‘What’ service of the cloud infrastructure costs us the most. A good chunk of the cost for AWS services is contributed by Elastic Compute Cloud (EC2). Other services that contribute to most of the AWS costs include AWS S3 and AWS RDS. As reported by CNBC, [more than 50%](https://www.cnbc.com/2021/09/05/how-amazon-web-services-makes-money-estimated-margins-by-service.html) of AWS’s revenue comes from the EC2 service. Now this may be equivalent to organizations spending most of their budget on the AWS EC2 service which cannot be descaled (in most cases) but can definitely be managed efficiently to reduce the monthly overall expenditure. An interesting example would be us, at unSkript, we were able to reduce our monthly AWS costs (mostly contributed by EC2) by 56% in the last month. We recently wrote a [blog post on how we track our daily EC2 costs](https://unskript.com/cloud-costs-charting-daily-ec2-usage-and-cost/). ## How to reduce AWS EC2 costs using the right Tags? Now that we have established EC2 cost reduction is a need more than a want, let’s dive into the simplest way to start your cost saving journey- using the right Tags. Tagging is an important part not only for cost optimization, but also for security, compliance and overall DevOps productivity. The most simplest way to start is by tagging a ‘Lifetime tag’ and ‘Termination tag’ to each and every instance that has been/will be created. - Lifetime tag - Tag to determine the expected lifetime of an instance - Termination tag - Tag to determine on exactly which date the tag should terminate Either one or both tags can be used to limit the time for which an instance is up. Depending on the format accepted by an organization, one can set up the relevant tag keys with the corresponding tag values as dates in the accepted date format. For example- Tag Key | Tag Value (dd-mm-yyyy) --- | --- lifetimeTag | 01-09-2023 terminationDateTag | 31-03-2023 Note - You can set the lifetimeTag to INDEFINITE to make sure it is never terminated. Here is a checklist to determine which instances should be terminated - 1. Using this AWS CLI command filter the instances without the lifetime **AND / OR** termination tags- ```sh aws ec2 describe-instances —filter Name=tag:{tag_name},Values={tag_value} ``` 1. Using this AWS console, get the launch date of the instance having the lifetime tag and check if the tag value (date) has passed tag value(date). 2. On the console again get the instances having the termination tag and check if the tag value (date) has passed current date ## Targeting the right instances One of the most powerful strategies we can utilize is targeting some EC2 instances and not the others. For example, we can target- - Production instances - Non-production instances - Batch-processing instances - Untracked instances (used by employees for testing or miscellaneous reason) We also need to understand that the strategy used for managing instances used for testing by employees cannot be applied to the instance that hosts the web server/ application. Hence it is important to use the correct tags for the right kind of instances. ## unSkript’s way of managing instance lifetime for cost optimization Although it is possible to manage the lifetime of an instance manually on a smaller scale by keeping a check on it on a periodic basis, as an organization scales upwards, it is hard to keep track of which instance to terminate and what it does. Once it’s done there are only 2 possibilities: there will be an outage because of incorrect instance termination or the organization may have some money on the table. At unSkript we have automated this process using a RunBook to find out the instances that have passed their lifetimen (or do not have a lifetime tag). By just giving in the tag key name you can filter instances not matching the aforementioned checklist and decide whether to terminate them with just a click. 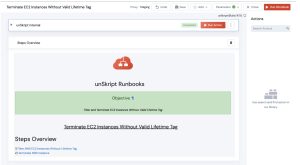 You can try it out on our open-source [Awesome-CloudOps-Automation](https://github.com/unskript/Awesome-CloudOps-Automation) repository on Github or on [us.app.unskript.io](http://us.app.unskript.io)

Cloud Costs Charting Daily EC2 Usage and Cost
Mar 22, 2024
When you buy a t-shirt at the store, you (generally) pay the same price for the shirt if you are an XS or a 2XL. In the cloud, the size of the Virtual machine you select has VERY large implications in the cost. At AWS, launching a t2.nano instance costs $.0058 an hour - or 14 cents a day, while a t3.2xlarge instance is $.4628 - or $11.11 a day. When sizing a new system, it is common to go a "bit larger" in size to ensure that the service performs well. This has worked well for AWS, as [over 50% of their revenue](https://www.cnbc.com/2021/09/05/how-amazon-web-services-makes-money-estimated-margins-by-service.html) comes from EC2 instances. In a [recent post](https://unskript.com/keeping-your-cloud-costs-in-check-automated-aws-cost-charts-and-alerting/), we built an automated RunBook to examine our daily spend for each AWS product, and EC2 (the green line) is far and away our biggest cost center: 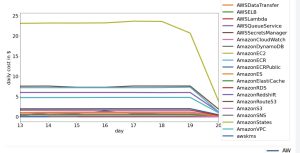 When looking at your highest cost center - you may wish to drill deeper into what these expenses are. In this post, we'll break down our daily EC2 spend by the types of instances that are running. ## Creating the RunBook In our last post, we built a RunBook that used the AWS Cost and Usage report to break down unSkript's costs product. By running the report daily, we could chart our daily cost spend per product, and if the change day over day exceeded a threshold, we could send an alert. To study our daily EC2 usage and spend, we will use the same Cost and Usage report, and the RunBook is essentially the same - just with a different SQL query into the table. Rather than recreate the RunBook, we will simply Duplicate the RunBook in the unSkript UI, and save it with a new name: 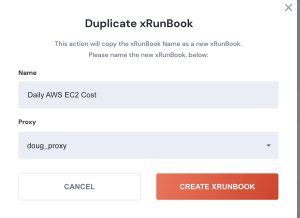 To run a AWS Redshift query, we need a SecretArn, the SQL Query, AWS Region and Redshift Cluster and database details. The RunBook generates these all for us, but we need to update the SqlQuery variable to query EC2 data: ```sql sqlQuery = f"SELECT date\_part(day, cast(lineitem_usagestartdate as date)) as day, product_instancetype,SUM(lineitem_usageamount)::numeric(37, 4) AS usage_hours, SUM((lineitem_unblendedcost)::numeric(37,4)) AS usage_cost FROM {tableName} WHERE length(lineitem_usagestartdate)>8 AND product_productfamily = 'Compute Instance' AND pricing_unit IN ('Hours', 'Hrs') GROUP BY day, product_instancetype ORDER BY 1 DESC, 3 DESC, 2 " ``` The next few steps of this RunBook is unchanged from the Product Cost RunBook: 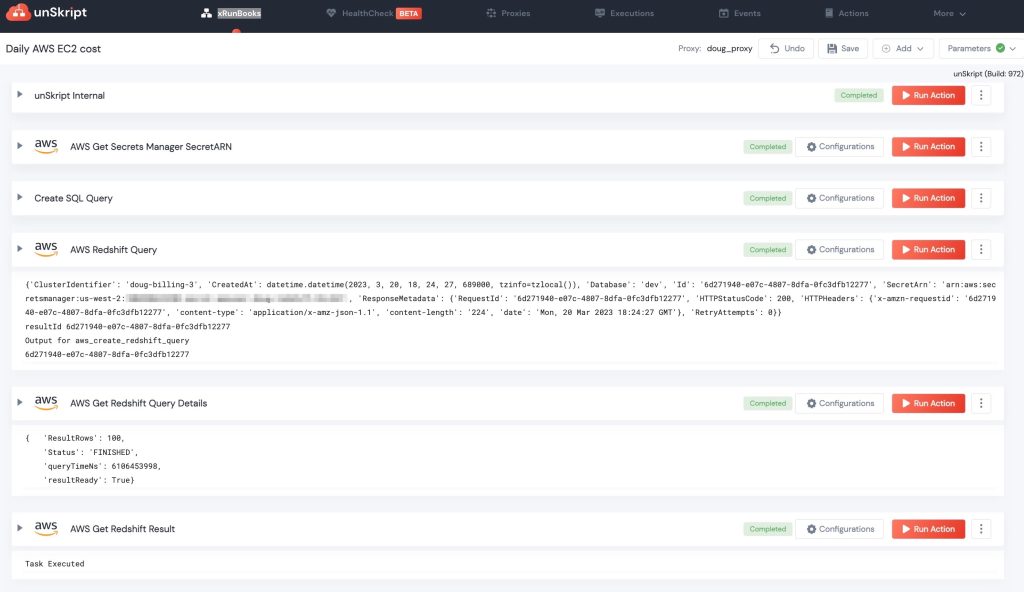 We take the Ann and the query - and run the query - then pull the results into the RunBook. We must now change the chart - since the inputs are different. Our Columns are now `product_instancetype` and the y values are `usage_cost`. Charting this data helps us see which instance types are costing the most money: 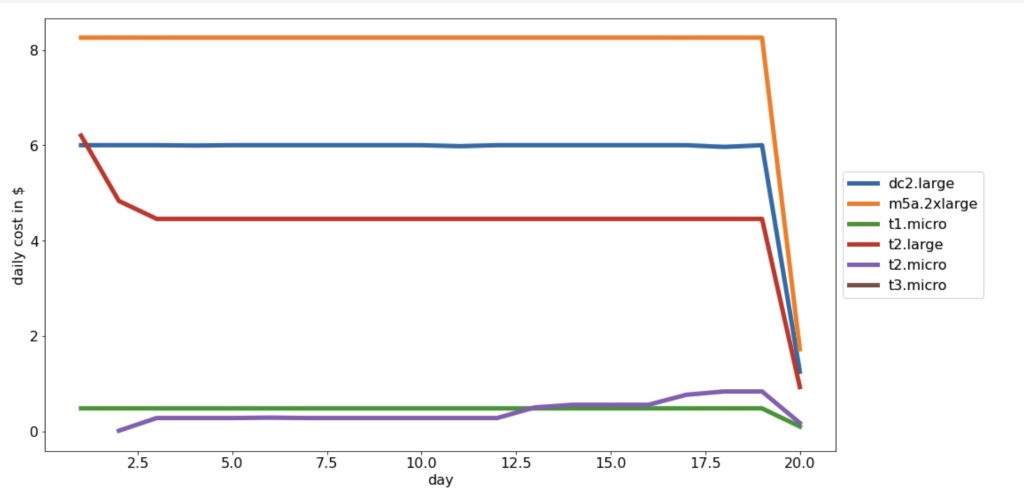 Our daily costs are very much proportional to size, with the 2xLarge and Large instances accounting for ~$20/day. It is interesting to note that earlier this month, our t2.large went down at the same time our t2.micro grew - this could possibly be interpreted as resizing of an EC2 instance that was too large. Finally, we can build alerts to tell us if any of our costs jump by over $1 a day, or 10%. If the costs make a jump we can send the chart EC2 usage to Slack using the *Send Image To Slack* Action (coming this week to our Open Source). We also send this image every Monday for a historical record: 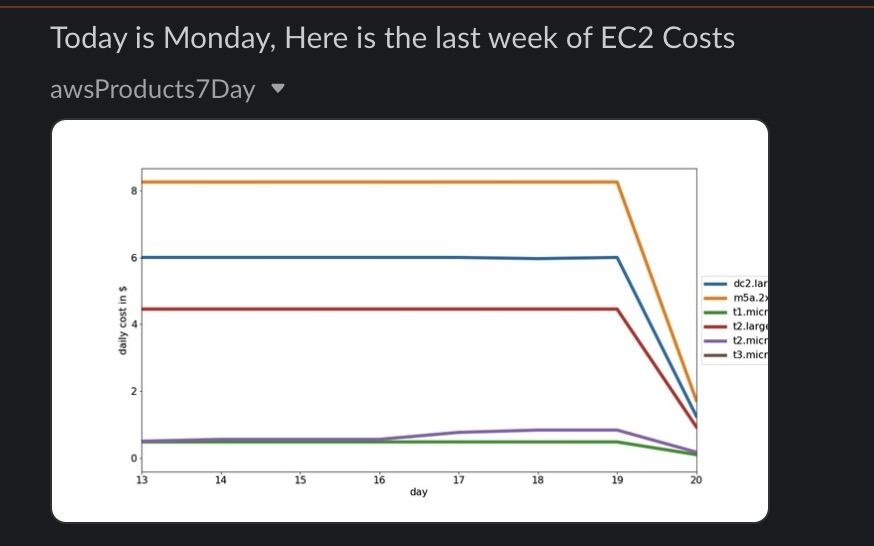 [](https://youtu.be/aZ6wUHCeWx0) ## Conclusion When it comes to FinOps - the team in charge of understanding and accounting for your cloud bill, one of the most critical tools to have is observability into your daily spend. If there is a large change - that might be ok - but it is good to know in advance, and double check that the increase is valid - thereby potentially avoiding a large bill at the end of the month. In our [previous post](https://unskript.com/keeping-your-cloud-costs-in-check-automated-aws-cost-charts-and-alerting/), we looked at all AWS products for daily cost spend, and in this post, we dug deeper to better understand our EC2 spend - the largest percentage of our AWS bill. Are you interested in trying out our alerting in unSkript? Try out our Open Source Docker build (and give us a star!), or sign up for a [free cloud trial](https://us.app.unskript.io/). Is there a segment of YOUR AWS bill that you'd like to investigate with us? Reach out in our [Slack channel](https://communityinviter.com/apps/cloud-ops-community/awesome-cloud-automation), and we'd be happy to help you create a RunBook for your use case!

AWS Service Quotas Discovering Where you Stand
Feb 17, 2024
We've written a few posts in the last week about AWS Service Quotas. These are restrictions on services that are set by AWS (but can often be increased). If our [first post, we looked at New Actions in unSkript](https://unskript.com/aws-service-quotas-what-are-they-and-how-can-i-increase-them/) that can be used to determine quota values and request a quota increase. In this post, we'll take the Actions a step further, and build an Action that compares the AWS quota to actual usage - generating an alert when a threshold is met. ## Getting Started To begin, we will need to consider how the Action will work. For any given service, we'll need to query AWS at least twice: 1. Get the Quota Limit. 2. Determine the usage of a service. Every query requires one call to complete Step 1. However, Step two can require many queries to complete the usage query. In the simplest case, we can do just one query: > Example: _Client VPN Endpoints per Region._ If we query AWS for the list of endpoints in a region, we can simply get the length of the response to know how many endpoints exist. However, there are times where there will be multiple queries: > Example: _Routes per Client VPN Endpoint_. In the first query, we get the list of VPN endpoints. In step 2, we must query every VPN endpoint to get the count of Routes. If there are 4 VPN endpoints, there will be a total of 5 calls made (On call to get the list of 4 VPN endpoints, and then one call to each of the four endpoints). To account for these two options, we create an input Dictionary. ## The Simple, one pass Dictionary For the _Describe AMIs_ call (only one Usage query is required), the Dict looks like this: ```json { 'QuotaName':'AMIs', 'ServiceCode':'ec2', 'QuotaCode': 'L-B665C33B', 'ApiName': 'describe_images', 'ApiFilter' : '[]', 'ApiParam': 'Images', 'initialQuery': '' }, ``` To get the Quota, we need the ServiceCode and the QuotaCode (If you need to obtain these variables, you can use the unSkript Action, or you can refer to the table in the [unSkript Docs)](https://docs.unskript.com/unskript-product-documentation/lists/test). The one usage API call will be made to the _describe\_images_ endpoint, and retrieve a list of _Images_. Counting this length gives us our usage. ## The Two Pass Dictionary To determine the _Attachments per transit gateway_, we must again get the quota from the Service Code and Quota Code. To get the count of attachments per transit gateway, we us the _initalQuery_ array to make a first query. The first query probes the _describe\_transit\_gateways_ endpoint, to give a list of _TransitGateways._ In the second set of calls, we call the _describe\_transit\_gateway\_attachments_ endpoint for each transit gateway. The filter has a string VARIABLE that is replaced with the _TransitGatewayId_ for each gateway -ensuring that each call is made to a different transit gateway. We can then count the length of the response to find out how many attachments are in each transit gateway. If we have 12 transit gateways. we will have 12 usage reports. ```json { 'QuotaName':'Attachments per transit gateway', 'ServiceCode':'ec2', 'QuotaCode': 'L-E0233F82', 'ApiName': 'describe_transit_gateway_attachments', 'ApiFilter' : '[{"Name": "transit-gateway-id","Values": ["VARIABLE"]}]', 'ApiParam': 'TransitGatewayAttachments', 'initialQuery': '["describe_transit_gateways","TransitGateways", "TransitGatewayId"]' }, ``` ## Outliers For most of our quota measurements, these two approaches work well. However, with over 2600 different quotas inside AWS, not all of them fit neatly into these two buckets. For example _Multicast Network Interfaces per transit gateway_ requires 3 calls: Transit gateways -> Multicast Domains - > Domain attachments. For others, there is custom code to iterate over. These require an extra if statement in the code to properly account for their usage. ## Action Format We can differentiate between the two types of query by looking at the 'initialQuery' parameter. If it is empty, we can do the Simple query, otherwise, do the double query (with a for loop that queries each initial result). For outliers, we can add specific code inside the if/else: (this is simplified a bit from what actually runs): ```python for i in table: #get quota sq = sqClient.get_service_quota(ServiceCode=i.get('ServiceCode'),QuotaCode=i.get('QuotaCode')) quotaValue =sq['Quota']['Value'] #get usage if i.get('initialQuery') = '': res = aws_get_paginator(ec2Client, i.get('ApiName'), i.get('ApiParam'), Filters=filterList) count = len(res) percentage = count/quotaValue combinedData = {'Quota Name': i.get('QuotaName'), 'Limit':quotaValue, 'used': count, 'percentage':percentage} result.append( combinedData) print(combinedData) else: res = aws_get_paginator(ec2Client, i.get('ApiName'), i.get('ApiParam'), Filters=filterList) for j in res: #build the filter query with some simple substitutions res2 = aws_get_paginator(ec2Client, i.get('ApiName'), i.get('ApiParam'), Filters=filterList) count = len(res2) percentage = count/quotaValue objectResult = {j[initialQueryFilter] : count} quotaName = f"{i.get('QuotaName')} for {j[initialQueryFilter]}" combinedData = {'Quota Name': quotaName, 'Limit':quotaValue, 'used': count, 'percentage':percentage} result.append(combinedData) ``` ## Action Output Once all of the values have been collected, the percentage utilized is compared to the warning percentage input. If the utilization is over the requested percentage, the Service data will be added to the output of the Action. With this information, the SRE responsible can decide the correct Action to take - either prune away some usage, or request an increase from AWS. For example, testing all VPC Service quotas with a earning of 50% utilization gives the following data: ```python {'Instances': \[{'Limit': 20.0, 'Quota Name': 'VPCs Per Region', 'percentage': 0.65, 'used': 13}, {'Limit': 20.0, 'Quota Name': 'Internet gateways per Region', 'percentage': 0.6, 'used': 12}, {'Limit': 5.0, 'Quota Name': 'NAT gateways per Availability Zone', 'percentage': 0.8, 'used': 4}, {'Limit': 50.0, 'Quota Name': 'Routes per route table', 'percentage': 0.5, 'used': 25}, {'Limit': 20.0, 'Quota Name': 'Rules per network ACL', 'percentage': 0.65, 'used': 13}\]} ``` ## Availability Today As we publish this article, we have 2 Actions heading into unSkript: 1. A general *AWS_Service Quota Compare Action* that has the basic framework described above. This will likely require customization for each Quota you wish to test against. 3. *AWS VPC Service Quota Warning*. This Action takes all of the VPC service quotas (as of February 2023) and tests them against your infrastructure. Coming Soon: *AWS EC2 Service Quota Warning*. This Action will test your infrastructure against all EC2 Service Quotas, and warn you if you are approaching the quota threshold. We're really excited to see how people use these Service Quota alerts in their infrastructure. If you have questions - feel free to reach out in our [Slack Community](https://communityinviter.com/apps/cloud-ops-community/awesome-cloud-automation). If you haven't tried unSkript - try our [OSS Docker Container](https://github.com/unskript/Awesome-CloudOps-Automation), or use our [free trial online!](https://us.app.unskript.io/)

AWS Service Quotas, or AWS has a LOT of Services!
Feb 15, 2024
In our [recent post](https://unskript.com/aws-service-quotas-what-are-they-and-how-can-i-increase-them/), we unveiled unSkript Actions that can query AWS Service Quotas. Service quotas are limits imposed by AWS on how many times a certain AWS feature can be used. Most of them are adjustable with a simple request, and our post showed how to determine your Service Quota values, AND request an increase using unSkript. In this post, I thought it might be fun to dig into AWS Service Quotas a bit deeper, and get s general idea of how Service Quotas fit into the AWS landscape. To get the Service Quota value, you need to know the Service Name, and the Quota Code. But how do you get these values? ## AWS Service Names We can get all of the AWS Service Names using the Service Node endpoint. Running this call, we find that there are 221 named services in AWS (as of Feb 15, 2023). AWS gets a [lot](https://ben11kehoe.medium.com/dear-aws-we-need-to-talk-about-service-naming-d33ea68027d8) [of](https://expeditedsecurity.com/aws-in-plain-english/) [flak](https://twitter.com/QuinnyPig/status/1070451608050315264) for their naming conventions, but with so many services, if course some are going to have sup-optimal names. Lucky for us, we'll be using the ServiceCode, and not the Service Name, so "_**AWS Systems Manager Incident Manager Contacts**_" is simply "**_ssm-contacts_**" and "_**AWS IAM Identity Center (successor to AWS Single Sign-On)**_" is just "_**sso.**_" ## AWS Service Quotas Next, we can run these 221 named services against the "List Service Quotas" endpoint to get all of the Service Quotas for all of the Services. Only 113 of AWS Services (51%) have features that have a service quota. Even with just half of services having quotas - there are a _**LOT**_ of preset quotas in AWS: 2,629 of them in fact! (Feb 15,2023) Service Code Count of Quota Name sagemaker | 702 ec2 | 131 iotwireless | 102 kinesisvideo | 82 rekognition | 80 personalize | 66 cases | 65 braket | 62 elasticmapreduce | 60 geo | 60 comprehend | 56 kms | 53 lookoutmetrics | 44 sns | 44 logs | 41 apigateway | 38 iotcore | 37 chime | 36 forecast | 33 ebs | 32 glue | 28 acm-pca | 26 fsx | 26 robomaker | 24 rds | 24 elasticloadbalancing | 22 dataexchange | 22 mediapackage | 22 monitoring | 22 cognito-idp | 21 elasticfilesystem | 21 vpc | 21 fis | 19 servicecatalog | 17 omics | 17 ssm-contacts | 16 application-autoscaling | 15 ssm | 15 cassandra | 14 frauddetector | 14 imagebuilder | 14 servicequotas | 13 workspaces | 13 textract | 13 lex | 13 events | 12 amplify | 11 appmesh | 11 route53resolver | 11 iottwinmaker | 11 databrew | 11 medialive | 11 rolesanywhere | 10 mgn | 10 access-analyzer | 9 eks | 9 groundstation | 9 nimble | 9 dms | 9 dynamodb | 9 workspaces-web | 8 ecr | 8 ivschat | 8 profile | 8 batch | 7 proton | 7 mediastore | 7 drs | 6 appconfig | 6 pinpoint | 6 schemas | 5 cloudformation | 5 athena | 5 m2 | 5 ivs | 5 ec2-ipam | 5 es | 5 refactor-spaces | 4 kafka | 4 resiliencehub | 4 app-integrations | 4 network-firewall | 4 resource-explorer-2 | 3 AWSCloudMap | 3 qldb | 3 ssm-sap | 3 mediaconnect | 3 auditmanager | 3 sms | 2 lambda | 2 guardduty | 2 ram | 2 ses | 2 autoscaling | 2 fargate | 2 cloudhsm | 2 outposts | 2 airflow | 2 dlm | 2 license-manager | 2 ssm-guiconnect | 1 connect-campaigns | 1 connect | 1 macie2 | 1 iotanalytics | 1 emr-serverless | 1 codeguru-profiler | 1 autoscaling-plans | 1 firehose | 1 codeguru-reviewer | 1 kinesis | 1 grafana | 1 ec2fastlaunch | 1 As Machine Learning can be a very expensive process, it is no surprise that Amazon SageMaker leads the pack with over 700 service quotas. 2nd in line is an oldie but a goodie, Amazon's EC2 (debuted in 2006!) with 131 quotas. ## What do we know about quotas? The longest quota name belongs to Rekognition, and it is quote a mouthful: _**Transactions per second per account for the Amazon Rekognition Image personal protective equipment operation DetectProtectiveEquipment**._ with a quota of 5. That's a lot of words to say that the service can scan 5 frames per second to identify a helmet, face mask or gloves on anyone in the picture. This quota can be adjusted, if desired. The largest Quota is **ElasticFileSystem's file size**, weighing in at 52673613135872 bytes. (Which, if I did my math correctly, is 47.9 TB). This is a hard limit and cannot be adjusted. The second largest quota is the **Maximum number of rows in a dataset** for **Amazon Forecast,** with a soft limit of 3 billion rows. You can request that this number be increased.  ## Quota adjustment Of the 2,629 quotas, 2,003 can be adjusted (76%), and 626 (24%) cannot be changed. ## Quota Units Only 87 of our quotas have units (3.3%). 20 are time based, and the remaining 67 are data sizes (of varying magnitude): Unit | Count ---- | ----- Bytes | 11 Kilobytes | 15 Megabits | 4 Megabytes | 13 Gigabytes | 22 Terabytes | 2 These vary from 200 ms (**API Gateway Maximum Integration Timeout**) to 30 days: **SageMaker's Longest run time for an AutoML job from creation to termination**. In case you were wondering, 30 days is also 2,592,000 seconds.) When it comes to units, there's nothing like arbitrarily multiplying by 1024 to change the units (and I see you MegaBits and your extra x8... but these are all throughput, so I'll give that a pass). The smallest value is **Lookout Metrics Value Length** at 40 Bytes, and the largest is **RDS Total storage for all DB instances** at 100,000 GB (or 97 TB). The winner for the oddest size measurement goes to **_Elasticfilesystem's Throughput per NFC Client_** at 524.288 MegaBytes. ## Summary While looking at the giant list of AWS Service Quotas, I thought it might be fun to look at the data more closely. It remains to be seen whether the unSkript team will continue to let me use PivotTables to look at data. More importantly, the list of Service quotas - with the Service Code and Quota Code are all in one table, and we have published the Feb 15, 2023 list in the [unSkript Docs](https://docs.unskript.com/unskript-product-documentation/lists/test). If you're interested in learning more about unSkript, join our [Slack Community](https://communityinviter.com/apps/cloud-ops-community/awesome-cloud-automation), or check out our [Open Source](https://github.com/unskript/Awesome-CloudOps-Automation) repo, you can run unSkript Open Source locally with Docker!

AWS Service Quotas What are they, and how can I increase them?
Feb 14, 2024
Everywhere we go, there are limits - speed limits, weight limits, capacity limits. AWS is no different. For many of the services offered by AWS, there is a service quota limit - the maximum number of that feature each account holder is allowed to use. ## Can we determine the limits imposed by AWS? Yes, the AWS _service-quotas_ API endpoint can tell us what quotas exist and their values? ## Can we ask for a limit increase? For most of the quotas, you can ask for your limit to be increased. In this post, we'll use Actions in unSkript to automate work around Service Quotas - determining limits, and asking for an increase to a quota. All of these Actions are soon to be a part of the unSkript [Awesome Runbooks GitHub repository.](https://github.com/unskript/Awesome-CloudOps-Automation) They'll also be included in all instances on unSkript. ## Probing the AWS Service Quota Surface The first step in understanding AWS Service Quotas is to look at the API. There are a few interesting endpoints, but in order to query a specific service or request a quota increase, we will need three items: - Region - Service Code - Quota Code We probably have a good idea what AWS Region our stack is deployed to - that's the easy part. We still need to understand and figure out the Service Code and the Quota Code for our service. ## Service Codes Service codes describe the top level services that AWS offers (think S3, EC2, etc.) To obtain the AWS Service Codes, we can utilize the _list-services_ endpoint in our Action named **AWS Get All Service Names v1**: ```python def aws_get_all_service_names(handle, region:str) -> List: sqClient = handle.client('service-quotas',region_name=region) resPaginate = aws_get_paginator(sqClient,'list_services','Services',PaginationConfig={ 'MaxItems': 1000, 'PageSize': 100 }) #res = sqClient.list_services(MaxResults = 100) return resPaginate ``` This lists all of the AWS Services by name and their service code. At the time of this writing, there are 220 (**edit** - it is now 221!) services in the output. ## Quota Codes Quota codes are available in the AWS Console interface, but it requires a lot of digging to get them (and sometimes it is easiest to find them in the url string). An easier way is via the API: The _list\_service\_quotas_ endpoint takes a Service Code (from the first list), and outputs all of the service quotas for that service. The **AWS Get Service Quotas for a Service v1** Action obtains the codes, given a Service Code Setting the Service Code to "ec2", and the Region to "us-west-2", we get 129 different Quotas (and the quota code for each one of them). ```python sqClient = handle.client('service-quotas',region_name=region) resPaginate = aws_get_paginator(sqClient,'list_service_quotas','Quotas', ServiceCode=service_code, PaginationConfig={ 'MaxItems': 1000, 'PageSize': 100 }) #res = sqClient.list_services(MaxResults = 100) return resPaginate ``` ## A sample output Here is a sample of the EC2 output: ```json {'ServiceCode': 'ec2', 'ServiceName': 'Amazon Elastic Compute Cloud (Amazon EC2)', 'QuotaArn': 'arn:aws:servicequotas:us-west-2:100498623390:ec2/L-70015FFA', 'QuotaCode': 'L-70015FFA', 'QuotaName': 'AMI sharing', 'Value': 1000.0, 'Unit': 'None', 'Adjustable': True, 'GlobalQuota': False} ``` This says that the limit for the number of Amazon Machine Images (AMIs) that you can share is 1000. ## Requesting a Quota Increase **What if we wanted to share 1001 AMIs?** We can request a quota increase via API. In the several attempts I have made, they were all grated automatically - but not immediately. Using the _request service quota increase_ endpoint in the **AWS Request Service Increase** Action adds your request to the AWS queue for processing: ```python def aws_get_service_quotas(handle, service_code:str, quota_code:str, new_quota:float,region:str) -> Dict: sqClient = handle.client('service-quotas',region_name=region) res = sqClient.request_service_quota_increase( ServiceCode=service_code, QuotaCode=quota_code, DesiredValue=new_quota) #res = sqClient.list_services(MaxResults = 100) return res ``` This Action has 3 inputs - the Service\_code, the quota\_code, and the integer value that you would like the quota changed to. ## Conclusion In this post, we built Actions using unSkript to learn what service quotas exist in your AWS Account, and how to update them. The Actions described in this post are built into unSkript's automation engine, allowing you to build custom RunBooks around service quotas in your AWS environment. Are you interested in learning more? Try out our Open Source Docker build. [Instructions can be found in the GitHub Readme file.](https://github.com/unskript/Awesome-CloudOps-Automation) If you have questions, join our [Slack channel](https://communityinviter.com/apps/cloud-ops-community/awesome-cloud-automation), where the community will be happy to help you! * Cover image is copyrighted by [Nick Mutton](https://www.geograph.org.uk/profile/15201), and is licensed for reuse under the [Creative Commons Attribution-ShareAlike 2.0 license](https://commons.wikimedia.org/wiki/Creative_Commons).

Copying AWS Amazon Machine Images Across Regions with unSkript
Jan 24, 2024
When you are building a distributed platform, You'll need to regularly update the machines that you have deployed around the world. With Amazon Web Services (AWS), one way to do this is to deploy the updated machine in one region, and create an Amazon Machine Image (AMI) of that server. Then, by copying that AMI to different AWS regions, you can easily deploy an identical server anywhere around the world. Copying AMIs across regions is possible to do via the AWS console UI, or using the AWS command line. At unSkript, we are working to remove the manual toil of running scripts against the command line, or performing multi-step manual processes in the UI. With hundreds of pre-built connectors and Actions to perform common tasks with the most popular cloud services - it is easy to get started with unSkript in just minutes. Try it today - either with our [Open Source Docker image](https://github.com/unskript/Awesome-CloudOps-Automation) that you can run on-premises, or with a [free trial of our Cloud](https://us.app.unskript.io/) offering. ## Copying AMIs across regions In your install of unSkript, there will be a RunBook called "[_Copy AMI to All Given AWS Regions._](https://github.com/unskript/Awesome-CloudOps-Automation/blob/master/AWS/Copy_ami_to_all_given_AWS_regions.ipynb)" This RunBook is pre-configured to perform the AMI copy with just the click of a button. When you open this RunBook (or import your copy into your work area), you'll only have a few steps before you can begin copying your AMIs. At the top of the page, there is a Parameters drop down, where the input parameters for the RunBook are entered: 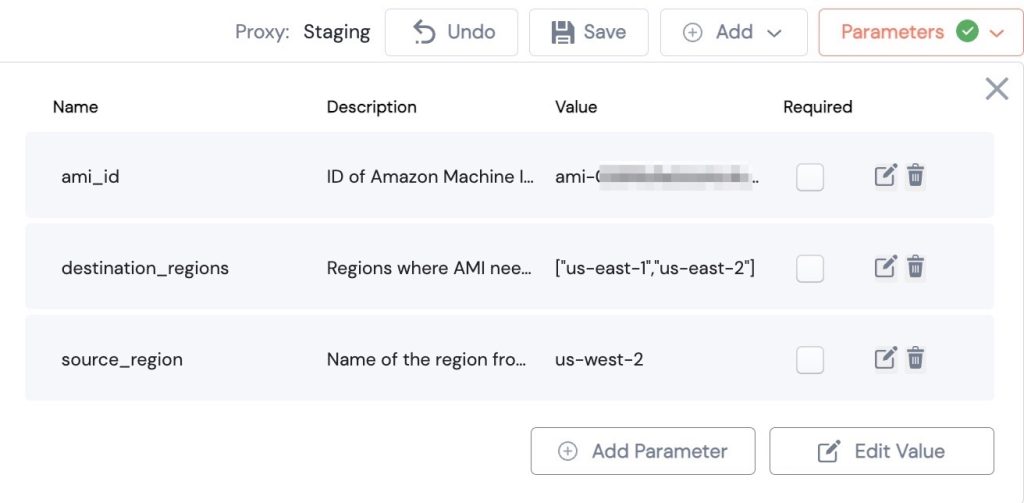 In the screenshot above, we have an _ami\_id_ (with pixelated name) with a _source\_region_ of us-west-2. We are looking to copy this AMI to the _destination\_regions_ us-east1 and us-east-2. These can be edited with the Edit Value button. When you run this RunBook via the UI - you will be give the opportunity to insert different values. ## Configuring the Actions Each step of the RunBook is completed by an Action. We will need to quickly configure each Action with credentials that allow unSkript to connect to AWS. If you do not yet have [AWS Credentials](https://docs.unskript.com/unskript-product-documentation/guides/connectors/aws#authentication) in unSkript, follow the link to set up your credentials. To Configure your action, click the Configurations button. On the right side, select the AWS credential you'd like the RunBook to connect with:  Connecting with the DevRole credential\[/caption\] Repeat this for all AWS Actions in the RunBook: - Get all AWS Regions - Get AMI Name - Copy AMI to Other Regions Once the credentials are set up, save your RunBook. It can now be run from this page in two ways: Run XRunBook button: or interactively - running one Action at a time. But it can now also be run via the RunBook listing page, or using our API. Here is the interactive output of the final Action, where the AMI image was copied into us-east-1 and us-east-2.  # Summary In this post, we utilized unSkript to automate the copying of AMI's across AWS regions. Rather than build a RunBook ourselves, we were able to utilize a pre-built RunBook, and simply configure the RuBook for our use case. With just a few steps, we were able to authenticate this RunBook to run in our AWS instance, and copy AMI images from one region to many other regions. By automating such repetitive tasks, unSkript alleviates DevOps toil of repetitive tasks, allowing the team to focus on more important projects. Give us a [try today](https://us.app.unskript.io/xRunBooks), and if you like what you see, give us a [star on GitHub](https://github.com/unskript/Awesome-CloudOps-Automation)! Questions? Join our [Slack Community](https://communityinviter.com/apps/cloud-ops-community/awesome-cloud-automation) - we'd be happy to help.

Managing your Cloud Costs with CloudOps Automation - Identifying Your Resources with Tags
Dec 15, 2023
Moving systems to the cloud makes a lot of sense operationally - letting the experts take care of the infrastructure, and let us build what we need to make our company successful. But this comes at a substantial downside - your monthly cloud bill. Cloud providers have made it insanely easy to spin up new servers and features, but without careful auditing - it is _very_ easy to leave money on the table due to unused or improperly sized resources remaining active on our cloud provider. In this series of posts, we’ll use unSkript to uncover unused assets in your cloud account, and then either alert the team of their existence, or remove them automatically. This of course leads to a catch 22 - how do you know what is safe to remove - and what will bring down production? In order to better identify our cloud resources, we need a good tagging strategy. So, to kick off our cost savings series of posts, we’ll begin with a discussion on tagging your cloud resources. ## **Why Tag your resources?** Tags are key:value pairs that describe your cloud function. With AWS, you can use any value for your key - giving the ultimate in customization. AWS has a number of [best practices](https://docs.aws.amazon.com/general/latest/gr/aws_tagging.html#tag-best-practices) for tagging your resources. Tagging allows us to easily identify our cloud components and quickly determine what the components do. AWS recommends “overtagging” vs “undertagging.” In many ways, this is the CloudOps analogy to commenting code. With a ‘well-tagged" set of resources, auditing each instance becomes easier. **Perhaps most importantly - it becomes easy to find resources that are no longer needed, allowing for them to be turned off keeping your cloud bill in check.** ## **Tag Strategy** There is no definitive set of tags that should be used, but here are some that are often discussed: - **Environments:** If your different environments are all in the same Cloud, labeling each object with an Environment key, and values like development, staging, production help you understand where in the deployment process your instances lie. - **Department:** Tagging the department that owns/controls the resource has a number of important features: 1. 1. The team can track their cloud installs. 2. If there is a problem with the instance, the correct team can be easily identified and notified that there is an issue. - **Cost center:** Identify teams with higher spends. More easily break down budgeting for cloud billing. - **Expiration:** When building out a new system, you may deploy a number of instances for testing. By setting a sunset date, you can remove any worry of accidentally leaving a cloud instance live - they will all shut down within a few days or weeks. ## **Building your tagging strategy.** If you have not yet built out your strategy, you probably have dozens (hundreds) of untagged cloud objects. Since there is no way for one person or team to know what each instance is, or even if it is still in use, we need to add tags. So the first step is to identify each object, and contact the owners to add tags to the instances. Of course, it would be best to give your team an automated way to add tags to their instances, so that they do not lose a lot of bandwidth complying with the new requirements (with the added benefit that an easy onboarding will make your new tagging policy go faster with less friction. Here's how we have done this at unSkript (using unSkript xRunBooks and Actions, or course). ## **Step 1 Find resources with zero tags** unSkript has a built in action called “**AWS Get Untagged Resources.”** This Action calls all EC2 instances that have no tags attached to them, We can search for this Action and drag it into our workflow. (In our [Free Sandbox](https://us.app.unskript.io/), create a new xRunBook, and then search for the action)  Connect your AWS Credentials (learn how to create a [connection to AWS](https://docs.unskript.com/unskript-product-documentation/guides/connectors/aws#authentication)), and add your Region (you can either change the value in the configurations to the right, OR change the parameters in the top menu - this refers to the variable _Region_). When run, this Action gives a list if instanceIds that have no tags. We’d like a bit more information, so we’ll edit the xRunBook to look like this: def aws\_get\_untagged\_resources(handle, region: str) -> List: print("region",region) ec2Client = handle.client('ec2', region\_name=region) #res = aws\_get\_paginator(ec2Client, "describe\_instances", "Reservations") res = aws\_get\_paginator(ec2Client, "describe\_instances", "Reservations") result = \[\] for reservation in res: for instance in reservation\['Instances'\]: try: #has tags tagged\_instance = instance\['Tags'\] except Exception as e: #no tags result.append({"instance":instance\['InstanceId'\],"type":instance\['InstanceType'\],"imageId":instance\['ImageId'\], "launched":instance\['LaunchTime'\] }) return result We make these changes to give a bit more information about each instance that is untagged. For example: \[{'imageId': 'ami-094125af156557ca2', 'instance': 'i-049b54f373769f51b', 'launched': datetime.datetime(2022, 12, 14, 17, 48, 49, tzinfo=tzlocal()), 'type': 'm1.small'}, Now we can reach out to the rest of the team to see if anyone knows about this m1.small instance launched on 12/14/22 from a specific AMI. ## **Step 2: Add tags to found instances:** We now have a list of all of the instanceIds that have no tags. Now we can use a new action that attaches tags to an EC2 instance to begin the process of bringing the instance into tagging compliance. This action has 3 inputs: _instanceId_, _Tag\_Key_, and _Tag\_Value_. def aws\_tag\_resources(handle, instanceId: str, tag\_key: str, tag\_value: str, region: str) -> Dict: ec2Client = handle.client('ec2', region\_name=region) result = {} try: response = ec2Client.create\_tags( Resources=\[ instanceId \], Tags=\[ { 'Key': tag\_key, 'Value': tag\_value }, \] ) result = response except Exception as error: result\["error"\] = error return result Running this Action adds the key:value tag into the EC2 instance. ## **Step 3: Compliance check** Finally, we’ll build one last Action that checks all tag Keys against the required list of keys, and returns those instances that are mossing a required tag: def aws\_get\_resources\_out\_of\_compliance(handle, region: str, requiredTags: list) -> List: ec2Client = handle.client('ec2', region\_name=region) #res = aws\_get\_paginator(ec2Client, "describe\_instances", "Reservations") res = aws\_get\_paginator(ec2Client, "describe\_instances", "Reservations") result = \[\] for reservation in res: for instance in reservation\['Instances'\]: try: #has tags allTags = True keyList = \[\] tagged\_instance = instance\['Tags'\] #print(tagged\_instance) #get all the keys for the instance for kv in tagged\_instance: key = kv\["Key"\] keyList.append(key) #see if the required tags are represented in the keylist #if they are not - the instance is not in compliance for required in requiredTags: if required not in keyList: allTags = False if not allTags: # instance is not in compliance result.append({"instance":instance\['InstanceId'\],"type":instance\['InstanceType'\],"imageId":instance\['ImageId'\], "launched":instance\['LaunchTime'\], "tags": tagged\_instance}) except Exception as e: #no tags result.append({"instance":instance\['InstanceId'\],"type":instance\['InstanceType'\],"imageId":instance\['ImageId'\], "launched":instance\['LaunchTime'\], "tags": \[\]}) return result This Action reads in a list of required keys, and if an instance does not have all of them - it is returned in an out of compliance list. ## **Conclusion** It has been shown that tagging cloud instances makes troubleshooting faster. It also helps you identify cloud objects that are no longer in use - helping you to reduce your cloud bill. For these reasons it makes sense to create a tagging requirement for all instances. In this post, we have created a series of Actions that will help you simplify the transition process of bringing all of your existing cloud objects into tagging compliance. Feel free to try these Actions in our [Free Sandbox](https://us.app.unskript.io/), or using our [Docker install](https://github.com/unskript/Awesome-CloudOps-Automation). The actions used in this post will soon be available on Github in the xRunBook [Add Mandatory Tags to EC2.](https://github.com/unskript/Awesome-CloudOps-Automation/AWS/AWS_Add_Mandatory_tags_to EC2.ipynb) Please reach out if you'd like a copy earlier!

Cloud Ops Auto Remediation - A Holiday Allegory
Dec 7, 2023
Auto remediations **are tools that respond to events with automations able to fix, or remediate, the underlying condition.** Building a demo that features auto remediation fix is hard, because generally modern infrastructure is resilient so keeping it in an error state is difficult. In order to feature an auto-remediation example, we’re going to get a little creative.  # A Holiday Auto Remediation I am writing this post in the first week of December, and let’s face it — holiday music is pretty inescapable this time of year. To describe the auto remediation that we will fix, let’s turn to one of the greatest fiction writers of our time:  As Mr. King has clearly presented — everyone has a least favorite holiday song, and the playing of this song can . During the holiday season, it is pretty common to use playlists generated by other users on Spotify. Wouldn’t it be great if we could auto remediate the playing of our disliked holiday songs automatically — without any intervention? This is a great example of building auto remediation — an xRunBook in unSkript that identifies the song playing, and if there is an “error state” (a song on the blocklist), the RunBook will correct this issue without human intervention. # Auto Remediation in Spotify In this post, we will build an auto remediation RunBook for your Spotify account. 1. We will create a Spotify app that connects with unSkript. 2. Curate a block list of songs. 3. We will build a xRunBook that checks to see if Spotify is playing. 4. If Spotify is playing a song on the block list, unSkript will automatically remediate the issue by skipping to the next track. 5. We can then place this xRunBook on a schedule to run every minute- ensuring that we’ll only hear a few seconds of our least favourite songs (at least when listening on \*our\* Spotify account). Note: This last step is only possible in the [Open Source Docker build](https://github.com/unskript/Awesome-CloudOps-Automation), or in a SAAS install of unSkript. This won’t work in the sandbox :( Let’s get started: # Build a Spotify app In order to interface with Spotify, we [create an app](https://developer.spotify.com/dashboard/applications) at Spotify. When you create an app, you’ll need to submit a redirect url. I used [unskript.com](https://unskript.com/) in my example. Once you generate the app, you’ll get a clientId and clientSecret that you will need later to interface with your xRunBook. You can also add your account email as an authorized user of the application:  The name and description of my Spotify application gives away \*my\* reasoning for this app. # Building the xRunBook NOTE: For full automation, install [unSkript locally using Docker](https://github.com/unskript/Awesome-CloudOps-Automation). If you just want to follow along the tutorial, you can use our [free Sandbox](https://us.app.unskript.io/) to run the xRunBook manually. (If you are using the Sandbox, complete the tutorial.) Now we are ready to create our xRunBook. - In Sandbox, Click xRunBook, and then “+Create”, and connect your RunBook to the proxy you created in the tutorial. - In Docker, there are instructions to create a new xRunBook in the README file. xRunBooks are based on Jupyter Notebooks. Each action is an independent Python application. When the RunBook is executed, each Action is run in order. I have pasted the code for each action below. You’ll need to create a new Action for each code snippet. Do this by Clicking the + Add button at the top, and choosing “Action.” **Action 1: Install Spotipy** We’re going to use a Python library to interact with Spotify. In your first action: !pip install spotipy - quiet **Action 2: Add our ClientIds.** In the OSS, and Sandbox, there is no built in Secret vault. so we’ll put them here. Make sure the redirect url matches what you placed in your Spotify application/ client\_id = "<client ID from Spotify>" client\_secret="<secret from Spotify" client\_redirect="https://unskript.com" **Action 3: Connect to Redis** Note: not needed for Docker, and will not work for Sandbox, but this will work in unSkript SAAS: import redis redis = redis.Redis(host='<redis-host>', port=6379, db=0) redis.set('foo', 'bar') True redis.get('foo') b'bar' print(redis) Spotipy stores the authentication in a local cache — which is fine in the unSkript Docker instance. The Sandbox does not have a local cache, nor a Redis instance, so this xRunBook cannot be run on a schedule as a result. In our SAAS version, a Redis database can be attached to the xRunBook to ensure that the credentials are stored locally, and can be reused. **Action 4: Find SongIDs** Let’s do some searches in the Spotify database to extract the songIds we want to add to our blocklist. Here we are searching for songs sung by Mariah Carey: import spotipy from spotipy.oauth2 import SpotifyClientCredentials scope = "user-library-read user-modify-playback-state user-read-playback-state" sp = spotipy.Spotify(auth\_manager=SpotifyClientCredentials(client\_id=client\_id, client\_secret=client\_secret)) results = sp.search(q='mariah carey', limit=5) #print(results) for idx, track in enumerate(results\['tracks'\]\['items'\]): print(idx, track\['artists'\]\[0\]\['name'\], " ", track\['name'\], " " ,track\['id'\]) The results for this Action are: 0 Mariah Carey All I Want for Christmas Is You 0bYg9bo50gSsH3LtXe2SQn 1 Mariah Carey Fantasy 6xkryXuiZU360Lngd4sx13 2 Mariah Carey Christmas (Baby Please Come Home) 3PIDciSFdrQxSQSihim3hN 3 Mariah Carey We Belong Together 3LmvfNUQtglbTrydsdIqFU 4 Mariah Carey Fantasy (feat. O.D.B.) 2itAOPLerxnnc8KXHMqPWu We want to (ok, I want to) block the song with ID: 0bYg9bo50gSsH3LtXe2SQn. **Action 5: Build a block list** This Action defines the array of songs we want to block. songList = \["0bYg9bo50gSsH3LtXe2SQn", "4iHNK0tOyZPYnBU7nGAgpQ", "0SorhWEyl6wkQ6vYAQt2D0"\] **Action 6: Authenticate the user** This requests access for a user at Spotify. We need to read the playback state (is Spotify playing?), and we need permission to modify the state (skip the song!). We have commented out the Redis cache\_handler. If you are using the SAAS version of unSkript — remove the comment. import spotipy from spotipy.oauth2 import SpotifyOAuth import json scope = "user-library-read user-modify-playback-state user-read-playback-state user-read-recently-played" spUser = spotipy.Spotify(auth\_manager=SpotifyOAuth(client\_id=client\_id, client\_secret=client\_secret, redirect\_uri=client\_redirect, \# cache\_handler=spotipy.cache\_handler.RedisCacheHandler(redis), scope=scope, open\_browser=False)) **Action 7: Skip the track** This step will be interactive. When this action is run, you’ll be asked to visit a url (that does a redirect) and then paste in the redirected url. This url has your authentication token in it. Once this is done, a token is stored locally that is valid for one hour. Every time the xRunBook is run, the token is re-authenticated for another hour. #get current track currentTrack = spUser.current\_user\_playing\_track() \## only test the playback if there is currently a song playing if currentTrack is not None: # track = currentTrack\["item"\]\["uri"\] print(track) #remove 'spotify:track:' from front of string to get the ID track = track\[14:\] print(track) \# all i want for christmas is you. spotify:track:0bYg9bo50gSsH3LtXe2SQn songs\_i\_hate = songList for song in songs\_i\_hate: print("song", song) if track == song: print("ahhh save us") spUser.next\_track() break else: print("its all good") else: print("the music is off") This completes the xRunBook creation. Save the RunBook (by closing it, and then selecting Save) **Scheduling the RunBook** In the SAAS (and Sandbox), it is possible to schedule your xRunbooks. By scheduling this xRunBook to run every minute — you can ensuyre that you’ll never have to listen to more than 59 seconds of the songs you dislike. # A Holiday Allegory An Allegory is a metaphor that symbolizes an idea or message. Many stories told at Christmas time are allegories (like Dicken’s a Christmas Carol). In this post, we have used Spotify playlists as an allegory to a Cloud System in distress. By auto-skipping songs, our unSkript RunBook is automatically solving a situation without involving a human (potentially paging them out of a “long winder’s nap.”) By building a “Skip the horrible track” auto remediation, we show the power of unSkript, and also potentially save the family Christmas by avoiding arguments over the Christmas playlist. Interested in learning more about how unSkript can help you build internal auto remediation tooling for your team? Check out our [free trial](https://us.app.unskript.io/signup), star our [GitHub repository](https://github.com/unskript/Awesome-CloudOps-Automation) of xRunBooks and Actions, or join our [Slack Community](https://communityinviter.com/apps/cloud-ops-community/awesome-cloud-automation)! [Cover image](https://stock.adobe.com/images/A-christmas-ornament-in-the-shape-of-a-radio-or-boom-box-hanging-on-the-Christma/313596242) licensed with the [standard Adobe Stock locesning](https://stock.adobe.com/license-terms)

Three Critical Capabilities for Intelligent Automation of Incident Response
Nov 29, 2023
In my last blog, we looked at the various challenges impacting incident response and [why its mostly a manual process](https://medium.com/unskript/why-is-incident-response-such-a-manual-process-73cdd517d442). It’s time to look at what it takes to introduce automation into incident response. We see this as a three pronged approach: platform, content & context and customizability. Let me explain. ## **Open and Extensible Platform** In my last startup, as we scaled our customer base, we were impacted by the classic operations toil that is so common in many acquisition stories. Whileeveryone agrees that we should “automate everything”, this is not quite the future we are living in. We dug deeper to understand why this is the case. One of the very first challenges we saw was a lack of standardization. There is a lot of tools with their own formats which poses two problems: 1. Learning curve 2. Private implementations of reusable modules  Let us start by acknowledging the reality that most operations teams are automating similar use cases in their playbooks, runbooks and scripts. While the exact combination of the building blocks is dependent on the particular context, the building blocks themselves are mostly identical. But in practice, a lot of teams we spoke to are reimplementing these building blocks in their environment. Even though the master copy is really in some community website that starts with stack and ends in overflow. Having duplicated the master copy into our environment, the second challenge is integration with the adjacent automation steps i.e. connecting the inputs and outputs of these individual building blocks. This can get quite complex since there is no standard framework for connecting different connectors and actions in a linear automation construct. We conclude that there is a need to have a uniform, open and extensible platform that allows integration of the building block automation with a standard and well understood framework in a safe and secure manner. First key aspect of the platform is human in the automation loop. Key to such a platform is the safety aspect. Automation can run away very easily and having the user control the behavior of the automation is almost a mandatory first <iframe class="fk aq as ag ce" title="Horrific Train Wreck, No Survivors" src="https://cdn.embedly.com/widgets/media.html?src=https%3A%2F%2Ftenor.com%2Fembed%2F3536707&display_name=Tenor&url=https%3A%2F%2Ftenor.com%2Fview%2Flego-train-fail-train-wreck-gif-3536707&image=https%3A%2F%2Fc.tenor.com%2Fh_MCJDYuCjAAAAAM%2Flego-train.gif&key=a19fcc184b9711e1b4764040d3dc5c07&type=text%2Fhtml&schema=tenor" width="600" height="400" frameborder="0" scrolling="auto" allowfullscreen="allowfullscreen" data-mce-fragment="1"></iframe> Lack of framework causes messy automation! step towards building confidence in the automation. Especially during the adoption phase when maturing of the concepts is questionable. Second key aspect of the platform is the need to be in an open and non-proprietary environment to ease the learning curve of tools and encourage reusability of building blocks. ## **Code, Content, Context** Continuing on the thread of an open ecosystem, a lot of the building blocks are being reused in an ad hoc way. The drivers of this behavior are convenience and lack of a framework to think about automation. Given an open platform and framework, we can focus on the reusability of the building blocks and also their lineage. As I mentioned earlier, a lot of these code snippets are sourced from social sites. But they are not catalogued well which leads to a lot of duplication within the organizations. For example the same organization can use a different implementation of a given functionality because of a lack of catalogue. A searchable catalogue also provides the benefit of composing the automation quickly. Additional contextual AI can help by suggesting the intermediate steps in the automation making the process easier. Lastly, we recognize that the social knowledge not only includes the code snippets, but also the context of the snippet. There is an opportunity to learn the context from the code snippets and apply this knowledge to suggest the correct automation to select given a use case or a live alert. ## **Customizability** The last mile of DevOps automation is always about making small tweaks to the boilerplate code that apply to a specific context or environment, i.e., customizability. Customizations could be thought of at two different levels. First, the ability to customize the individual step in a sequence of steps. In order to accomplish this objective, we need for the individual steps to be open with an ability to make changes easily. In the graphical tools we saw, this ability gets lost and while in theory the tool allows customization, in practice the operator has to learn around the interface and try to conform to the screen in front of him. The second level of customization applies to how the individual building blocks are connected together to actually accomplish the task at hand. Again what we see is that the existing tools make it difficult to accomplish these customizations because of an invisible framework at play that forces the users to work with the screen, rather than the tool working with the user. Not having easy customizations is usually the death knell of workflow tools because of the static flows it creates. ## **What does such a platform look like?** How would that open and extensible platform look like? How will it bring content, context, and code to improve DevOps collaboration, and ops shift-left? What would the customizability look like? I plan to cover a lot of the “how” in my next blog, stay tuned. Oh but if don’t want to wait that long, I happen to be at AWS re:Invent, if you’re too then we can geek out on the how. I can also share notes in terms of what we’re seeing with our customers and peers of yours. Same time, learn your specific use cases to see if I can add value to your journey. I can be reached at [LinkedIn](https://www.linkedin.com/in/absaxena/) or drop me a note at [abhishek@unskript.com](mailto:abhishek@unskript.com)

How to perform an Elasticsearch Rolling Restart
Nov 21, 2023
## How to perform an ElasticSearch Rolling Restart Database-driven search engines often take a long time to respond to queries. This is where search engines like Elasticsearch come into play by storing, retrieving, and managing data using a NoSQL database. Even though the primary purpose of Elasticsearch is to make the data available at all times, there may come a time when one needs to perform a restart of the cluster. And doing this task the right way is very important to ensure that the cluster is still operational during its maintenance even for a heavily active production cluster. To perform this process, Elasticsearch offers a Rolling Restart option where each node can be incrementally stopped and started in a cluster. This allows a node undergoing maintenance to pick up configuration changes that require a restart while ensuring high availability of the other nodes. ## Reasons to restart a cluster The most common reasons to restart a cluster are- 1. Elasticsearch version upgrades to get in all the newly rolled-out features operational on stack 1. Maintenance of the server itself (such as an OS update, or hardware). 1. To perform changes in the configuration file (elasticsearch.yml). 1. Duplicate directory errors There can be a number of reasons why an Elasticsearch cluster needs to be restarted and it is generally not a plausible solution to shut down the entire cluster but to rather perform a rolling restart where each node is made to restart one by one. ## Steps to perform Elasticsearch Rolling Restart By default, Elasticsearch ensures that your data is fully replicated and evenly balanced. So, if a single node is shut down for maintenance, the cluster will immediately recognize the loss of the node and begin rebalancing. Very large shards can take a longer time to rebalance, so if the node’s maintenance will be short-lived, it can get frustrating where the cluster is rebalancing on its own — think of replicating 1 TB of data. Hence, a planned restart of the nodes should include stopping the routing of traffic to avoid any unnecessary rebalancing. What needs to be done is that Elasticsearch should be made to hold off on rebalancing on its own, since we have more knowledge about the state of the cluster due to external factors. Here are the steps to perform a rolling restart- Step 1- Stop indexing new data- This is not always possible (e.g. heavily active production cluster) but might help to speed up recovery time. To stop indexing run the following- ```sh curl -X POST "localhost:9200/<target>/_flush?pretty" ``` Step 2- Disable shard allocation- This prevents Elasticsearch from rebalancing missing shards until you tell it otherwise. As stated earlier, if the maintenance window is short, this is a good idea. You can disable allocation as follows- ```sh curl -X PUT "localhost:9200/_cluster/settings?pretty" -H 'Content-Type: application/json' -d'{ "transient" :{"cluster.routing.allocation.enable" : "none"}}' ``` Step 3- Shut down a single node using these commands- With systemd: ```sh sudo systemctl stop elasticsearch.service ``` With SysV init: ```sh sudo -i service elasticsearch stop ``` For daemon- Manually kill the process running Elasticsearch Step 4- Perform maintenance/upgrade on that node. Step 5- Start the node- If you are running Elasticsearch with systemd: ```sh sudo systemctl start elasticsearch.service ``` If you are running Elasticsearch with SysV init: ```sh sudo -i start elasticsearch stop ``` Step 6- Check logs- to confirm if the cluster has rejoined in /var/log/elasticsearch Step 7- Reenable shard allocation- ```sh curl -X PUT "localhost:9200/_cluster/settings?pretty" -H 'Content-Type: application/json' -d'{ "transient" :{"cluster.routing.allocation.enable" : "all"}}' ``` Step 8- Check cluster health- The status should become green and can be checked using- ```sh curl -XGET 'localhost:9200/_cluster/health?pretty' ``` Step 9- Repeat steps 2 through 7 for other nodes in the cluster if required Step 10- Indexing can be safely resumed (if it was previously stopped), but waiting until the cluster is fully balanced before resuming indexing will help to speed up the process. ## Perform Rolling Restart using unSkript As we know that upgrading and maintenance of a cluster should be a regular process in an organization, but it does become tricky at times to do it the right way and ensure availability of the nodes to avoid interruptions in indexing. unSkript provides an open-source runbook to perform Elasticsearch Rolling Restart and standardize this automation as a part of your organization’s DevOps practice. You can try it out on our open-source Docker instance found at [Awesome-CloudOps-Automation](https://github.com/unskript/Awesome-CloudOps-Automation) on GitHub. Or try it in our [Free Cloud Trial](https://us.app.unskript.io).

DNS: Is your domain healthy?
Nov 16, 2023
# DNS: Is your domain healthy? When your website goes down, you risk losing customers, revenue, and credibility. When there is an issue — it is critical to know as quickly as possible in order to resolve the problem. In this post, we’ll build an automated Runbook to check the DNS of our website at regular intervals. We all know the joke about outages and DNS- we put it on t-shirts, we’ve written poetry about it. Sometimes, no matter what we think the cause of our outage might be, it ends up being a DNS issue. 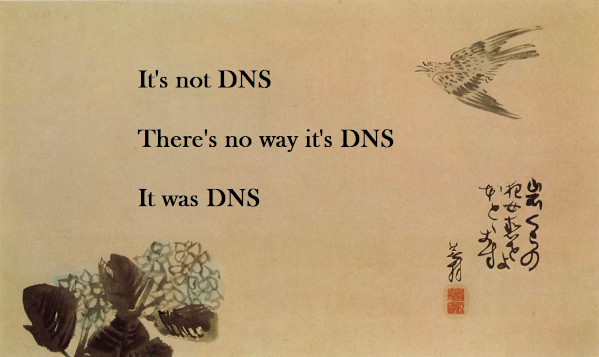 It’s always DNS haiku In this post, we’re going to build a simple DNS health check API using [unSkript](http://unskript.com/), using our free Runbook Sandbox. # **What is unSkript?** unSkript is a DevOps/SRE automation platform that allows for fast and easy automatic RunBook creation. Built on top of Jupyter Notebooks, it uses Python to automate and simplify your daily DevOps workflows. It’s built on an [open source library](https://github.com/unskript/Awesome-CloudOps-Automation), and we have hundreds of Actions ready for you to connect into your RunBooks (and more Actions are being created every day!). In this example, we will build a xRunBook with two steps (or Actions): 1. Check the DNS of a domain, 2. If there is an issue — we’ll send a message on Slack. If you’d like to build your own by following the steps below, you can sign up for free at [unSkript.com](http://unskript.com/). # Creating our DNS check Runbook 1. Sign in to the [unSkript Sandbox](https://us.app.unskript.io/login). If you have not used the Sandbox before, walk through the short tutorial on how to use it. It will set up some of the features (like a proxy) that you’ll need. 2\. Click xRunBooks from the top nav, and click the `Create` button.  3\. This will open a dialogue to name your runbook and select a proxy (that you set up during the onboarding flow). I named mine \`check\_dns\_runbook\`, gave a short description and assigned my proxy. 4\. Now, we have our Runbook, and are ready to build. unSkript is built on top of Jupyter Notebooks, so if you are have used Jupyter before, this should look familiar (if not — don’t worry — it’s just Python). 5\. In the top menu, click `Parameters`. Parameters are the input key:value pairs for the Runbook — much like API inputs to customize each call of the API. Add a Parameter named url, and give it a default value to unskript.com (You can use your own domain, of course).  adding an input parameter for the url. 6\. We have our url that we’d like to check — let’s add the code to actually check the DNS. Create an action by clicking **Add** **\-> Action** from the top menu. 7\. Name this action check\_dns, and paste in the following Python code: import dns import dns.resolver def get\_dns(url): try: result = dns.resolver.query(url, ‘A’) for ipval in result: print(‘IP’, ipval.to\_text()) except: result = “none” print(result) return result result = get\_dns(url) This is a simple DNS checker. If the DNS resolves, the variable result holds the IP address. If it fails, result is “none.” 7\. With unSkript, you can test each action individually (even before the full Runbook is completed!). Click “Run Action” at the top of this Action. Assuming unskript.com’s DNS can be resolved (and you can bet we are running this Runbook internally, and working to keep the site up!), you’ll get an IP back. 8\. Now we have DNS details, but what we want to do is send a message on Slack that says “hey the website is down!” (when the website is down, of course). To do this, we’ll use an existing Action from the unSkript library. Searching in the Actions navigation on the right, we’ll drag the “Post Slack Message” Action into our xRunbook.  Searching for pre-built actions, and adding the Post Slack Message Action to our Runbook. 9\. This Action requires connecting to Slack. This requires a Slack app. that is connected to the Slack Channel you wish to broadcast the message on. We’ve written up a [guide on how to create an app with Slack](https://docs.unskript.com/unskript-product-documentation/guides/connectors/slack#creating-a-slack-oauth-access-token). 10\. Now, we’ll create a Slack Credential at unSkript by clicking Credentials, and adding a Credential. Give it a name, and paste in your OAuth token from the previous step. (You can manage all of your Credentials by clicking “Proxies” and then choosing a proxy.) 11\. You’ll need to pick the channel you’re sending the message to, and the message itself. These inputs are Python, so if you are adding a string, add quotes.  inputs for our Slack Action If we were to run this Runbook now, every time it runs, we’d get a message that the url is failing (even if everything is fine!). So, we only want the Slack Action to fire when the check\_DNS Action fails. We can use the “Start Condition” variable to only run the Slack code when \`\`\`result is “none”\`\`\`.  Now the Post Slack message will only run, if the DNS Action has failed -removing any noise from the alarm. # Scheduling the RunBook Having a RunBook that tests DNS of a website is great, but it needs to run on a regular cadence. unSkript can schedule RunBook runs. Close the RunBook (be sure to save it), and choose Events from the top navigation (and then choose schedule). The following setting will run this xRunBook every 5 minutes:  Choose your url, and your RunBook will monitor the DNS health of your website for you. You can monitor the executions of the RunBook, and after a few hours, our DNS has been holding up quite well (as it should be):  # Conclusion In this post, we have built an alarm for our website’s DNS. Every 5 minutes, our RunBook checks the sites DNS, and if it fails to find an IP address, sends an alert to Slack so that the engineering team is alerted to the issue. We build a custom Action using Python to check the DNS, but imported an existing Action from the unSkript library to send the Slack message. We have many pre-built actions for many leading platforms, and we love submissions of Actions and xRunBooks to our [Open Source Collection](https://github.com/unskript/Awesome-CloudOps-Automation). Try our unSkript for free, and feel free to reach out in our [Slack Community](https://communityinviter.com/apps/cloud-ops-community/awesome-cloud-automation) if you have any questions. \[/vc\_column\_text\]\[/vc\_column\]\[/vc\_row\]

Why is incident response such a manual process?
Nov 8, 2023
## Tell tale signs that you need to take a close look at your MTTR In today’s agile world, service reliability can be directly correlated with customer satisfaction and successful business outcomes. However, manual incident response can affect your service reliability for the following five reasons. Let’s walk through them one at a time. ## Too many alerts, too little intelligence (for actionability). Writing alert threshold is more of an art than a science. The thresholds for an alert are contextual and subject to things like time-of-day or seasonality. Consequently alerts need to be investigated in context and that results in more often than one would like. The on-call engineer is really looking to answer “is this expected”. More often than not, we fall into the “this is expected” bucket. This is what makes operations such a toil. The manual incessant activity associated with checking context signals for an alert just to be able to say that this is expected. ## **Tribal knowledge hurts everyone!** Being a Subject Matter Expert is simultaneously a matter of both pride and frustration. After working on a product/feature, engineers pick up a host of knowledge about some narrow areas. While tribal knowledge is good for job security, it also means that when failures happen in production, this undocumented knowledge leads to panic calls that need to be taken from the beach and spoil the fun for entire family. A hanging sword all the time is not really worth the perks that go with it. Runbooks are a great way of combating this organizational problem.  ## Runbooks are located on an island; one that the ship called SDLC does not visit. The best resource to triage and troubleshoot incidents is a Runbook. These are the investigation and/or mitigation plans that is written when the alert rules are being configured, or when the service or user journey is designed. This is the best time to capture why the alert was configured, what are the dependencies, and what should be done to handle it. However, since runbooks and alerting are not in SDLC, and hence they tend to fall out of date very quickly. Our best bet for handling incidents is given a step-child treatment. The process to keep them up to date is manual and discretionary. Runbooks need to shift left too. ## In the API economy, your reliability is a function of reliability of all the APIs that you use. Modern applications are built on top of a host of APIs from third parties. Diagnosing incidents need a single integration platform which can communicate with the broad dependency graph that is present in modern applications. Such a “control tower” needs to have the ability to interrogate not just the local resources within the DMZ but also the third party APIs and services if one wants to get the full picture of application health. We saw this play out [recently with the famous Facebook (Meta?) outage](https://medium.com/unskript/domino-effects-of-the-facebook-outage-cd4a7f63c245). ## Tool Sprawl make locating context difficult. Observability is spread across a breadth of tools. This leads to alerting also being spread across a breadth of tools. Gathering and correlating context from this set of tools is an onerous task and one that has to be done during incidents. This also makes writing a health check dashboard complicated because these signals need to be collected from the tool sprawl. The rate of change in software makes this entire operation an ever-moving target. While there are “single-screen” solutions available today, we see often that there is still some remaining context that is locked away and inaccessible through the “single-screen”. Developers go through a different screen, back-door and/or scripts to get this context. ## But what if incident response could be automated? When the proverbial pager beeps, the first task of the incident response team is collecting information from a number of sources. Once it is collected, the on-call team can analyze the data and escalate accordingly. However, acquiring data from multiple sources and then analyzing them is contextual and time consuming. Having a dynamic workflow that allows for easy interrogation of tool sprawl would go a long way removing toil. In my next blog, I will walk through the critical capabilities needed to automate incident response, perhaps bringing in the notion of automated runbooks. \[/vc\_column\_text\]\[/vc\_column\]\[/vc\_row\]

Part 3 - Proactive Diagnostics and Remediation for Platform Reliability and Incident Response
Oct 24, 2023
In our [first post we answered](https://medium.com/unskript/part-1-what-is-incident-response-how-does-it-work-and-what-do-the-best-do-67d258bb85d4) how you can start or improve your incident response using runbook automation in your organization. The second post gives you a framework for evaluating processes and technologies for the phases we see that leading organizations are building in the space. In this third post, we discuss how modern tooling being designed today and for the future enables proactive management through both monitoring and probing for signals of degradation before they become issues, real-time automated remediation of the unhealthy apps and infrastructure, as well as escalation of unaddressable issues to appropriate teams. # **Proactive Automation for Platform Reliability and Incident Avoidance** Leaders are building proactive apps to manage the confluence of increasingly complex tech stacks, the API-economy, and continued WFA affecting staff all creating an incredibly challenging environment for IT professionals. Add in uncertain grid stability and ridiculous numbers of cybersecurity threats and the need for proactive platform reliability becomes a must have. On a brighter note, Forrester also noted that in 2022, Intelligent Automation (IA) will generate $134 billion in labor value by enabling businesses to shift staff, skills and investment toward critical functions such as innovation, augmenting the customer experience or operational efficiency. Key goals for Proactive Automation: ## How to reduce burnout among IT and SecOps professionals? CardinalOps discovered that 15% of SIEM rules lead to 95% of the tickets handled by a SOC, demonstrating that a small percentage of noisy rules overwhelm SOC analysts with distracting false positive alerts, thus leading to burnout. ## How to boost ROI? Ponemon reported nearly half of the organizations surveyed by researchers (45%) predicted salaries to jump an average of 29% in 2020. The report said that more than half the costs of running a SecOps are labor-related, with the average cost of maintaining a SOC being around $3 million — $1.46 million for labor, and $1.4 million for everything else. ## How to modernize critical organizational functions for SRE and SecOps? The new generation of dev tools and IT technologies are being designed to solve issues around alert fatigue, tool inundation, disparate data sets, burnout and more. Modern tools need seamless ingestion of telemetry and myriad other IT and security tool data, use AI/ML proficiently, and have automation and remediation natively built into workflows. # **Hyper Automation is transforming operations** Current conventional wisdom is that AI is the key to transforming any enterprise application, but the reality is that most AI requires serious “data ditch digging” to get to the point of benefiting an enterprise. AI is only part of the transformational equation, and the second (and frequently missing) missing part is Robotic Process Automation or RPA. And when AI and RPA are correctly combined and applied, the result is hyperautomation. The pandemic created an inflection point, prioritizing workers’ safety and the technologies needed to support them, and the labor shortage which began before the pandemic has become even more challenging of a constraint to deal with, which is accelerating the use of hyperautomation to improve process performance from the shop floor to the top floor. # **Proactive Diagnostics and Remediation as part of a digital immune system** _76 percent of teams responsible for digital products are now also responsible for revenue generation._ CIOs are looking for new practices and approaches that their teams can adopt to deliver that high business value, along with mitigating risk and increasing customer satisfaction. A digital immune system provides such a roadmap. “Digital Immunity” combines data-driven insight into operations, automated and extreme testing, automated incident resolution, software engineering within IT operations and security in the application supply chain to increase the resilience and stability of systems. _Gartner predicts that by 2025, organizations that invest in building “Digital Immunity” will reduce system downtime by up to 80% — and that translates directly into higher revenue._  Automated diagnostics with corresponding “one-click” remediation for critical services # **Business Value** Our customers and prospects find value in our AI-driven, Diagnostics create a foundation for _preventing_ many issues around Platform Reliability, Incident Response, and Security and Compliance. Our mission, like yours, is to provide your employees / faculty / partners, your customers / students / patients, and more with safe, user-friendly and secure work environments by: - **Boosting User Experience** — by reducing all phases of incident response — lowering alert noise , firefights and triage, and incident repair, all leading to gains in operational efficiency (FTE Service Savings per site / per shift is one key metric) - **Boosting DevOps and SRE productivity** — As Forrester noted, Intelligent Automation (IA) will generate $100+ billion in value by shifting skilled staff toward more mission-critical functions such as product innovation vs IT support - **Reducing Both the Number of Issues to Resolve and MTTR on Issues —** with AI/ML-powered, automated remediation that have driven 50% boosts in DevOps efficiency for some of our customers 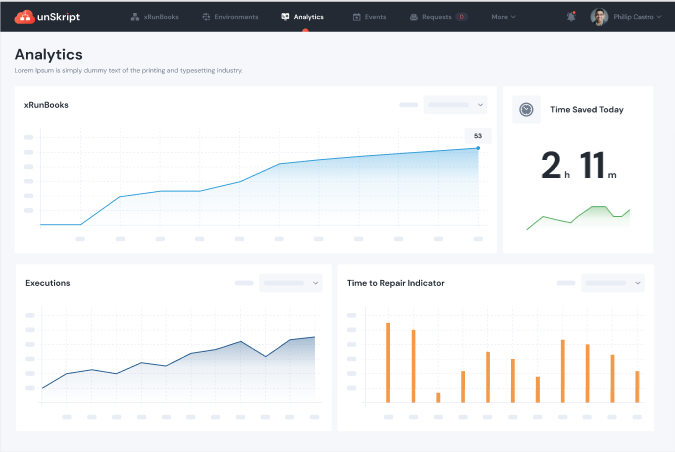 RunBook automation driving down Time to Repair Each of these benefits on their own can offer 5–6 figure USD savings per year, shortening the payback period on your investment. **To try one of our individual runbooks for one of your critical services — Kubernetes, AWS, Kafka, Elastic, and dozens more today on** [**GitHub**](https://github.com/unskript/Awesome-CloudOps-Automation)**.** **Or** [**contact us**](https://unskript.com/contact.html) **for a personalized demo of the full, proactive automation platform.**

Part 2 — Best Practices for Modern Incident Response Why Monitoring, Alerting and Remediation are Not Enough
Oct 7, 2023
This second post in a 3-part series specifically looks into the ways leading organizations handle incident response today. In our [first post we answered](https://medium.com/unskript/part-1-what-is-incident-response-how-does-it-work-and-what-do-the-best-do-67d258bb85d4) how you can start or improve your incident response using RunBook automation in your organization. The second post gives you a framework for evaluating processes and technologies for the three phases we see that leading organizations are building in the space. With 97% of respondents in a recent survey reporting that their leadership has reliability priorities for cloud infrastructure, we are focusing on platform reliability, with a specific view into improving Kubernetes management. Modern diagnostics tools enable proactive management through constant monitoring and probing for signals where issues may be arising, real time or almost real-time automated remediation of addressable issues, and escalation of unaddressable issues to appropriate teams.  ## Issues with Traditional Incident Response Today, there are many who define incident response as a collection of activities — the three pillars being monitoring, alerting and remediation. For traditional organizations these are critical inputs to incident response, where teams are then called in, issues prioritized, investigated, and resolved. While all three are inputs to incident response, they are not solutions in and of themselves. Rather than focusing on a specific outcome, this siloed approach to observability (detect), prioritization (inspect), and response (protect) is typically focused on technical instrumentation and underlying data formats. While having all three help you triage, they are no guarantee you can respond to issues more quickly. Ironically, more monitoring and alerting may actually slow down reaction times and resolution, creating issues at scale. ## Present-Day Incident Response for Platform Reliability Containers and µ-services, today’s cloud infrastructure of choice, has broken traditional incident response. Specific to Kubernetes, a highly sophisticated yet complex, container orchestration and management platform, we can apply these three stages to K8s troubleshooting of applying solutions to common errors, which may include CreateContainerConfigError, ImagePullBackOff, CrashLoopBackOff, Kubernetes Node Not Ready and many more…  ## Present-Day Alerting — Prepared to spot issues Reviewing recent changes to clusters, pods, nodes, or other potentially affected areas to find root cause. - Analyzing YAML configs, Github repos, and logs for VMs or bare metal machines running the malfunctioning components. - Looking at Kubernetes events and metrics such as disk pressure, memory pressure, and utilization. In a mature environment, you should have access to dashboards that show important metrics for clusters, nodes, pods, and containers — ideally in time-series formats. - Comparing similar components for outliers, analyzing dependencies… To achieve the above, teams typically use the following technologies: - Monitoring Tools: Datadog, Dynatrace, Grafana, New Relic - Observability Tools: Lightstep, Honeycomb - Live Debugging Tools: OzCode, Rookout - Logging Tools: Splunk, LogDNA, Logz.io This allows you to see issues with and between services, though stops at the identification and notification of the issue. ## Present-Day Triage — Automated Management of Issues In µ-services architectures, it is common for each component to be developed and managed by separate teams. Because production incidents often involve multiple components, collaboration is essential to remediate problems fast. Once issues are understood, there are three main approaches to remediating them: - Ad hoc solutions — based on tribal knowledge by the teams working on the affected components. Very often, the engineer who built the component will have unwritten knowledge on how to debug and resolve it. - Manual RunBooks — a clear, documented procedure showing how to resolve each type of incident. Having a RunBook means that members of the team can quickly resolve the issue in a similar (hopefully tested) manner.. - Automated RunBooks — an automated process, which could be implemented as a script, infrastructure as code (IaC) template, or Kubernetes operator, and is triggered automatically when the issues are detected. To achieve the above, teams typically use the following technologies: - Incident Management: PagerDuty, Kintaba - Project Management: Jira, Monday, Trello - Infrastructure as Code: Amazon CloudFormation, Terraform It can be challenging to automate responses to all common incidents, but it can be highly beneficial, reducing downtime and eliminating human error. ## Present-Day Remediation — Prepared to Respond Successful teams make prevention their top priority. Over time, this will reduce the time invested in identifying and troubleshooting new issues. Preventing production issues in Kubernetes involves: - Creating policies, rules, and playbooks after every incident to ensure effective remediation. - Investigating if a response to the issue can be automated, and how - Defining how to identify the issue quickly next time around and make the relevant data available — for example by instrumenting the relevant components - Ensuring the issue is escalated to the appropriate teams and those teams can communicate effectively to resolve it To achieve the above, teams commonly use the following technologies: - Chaos Engineering: Gremlin, Chaos Monkey, ChaosIQ - Auto Remediation: Shoreline, OpsGenie  ## **A Modern Approach — Preventing vs Preparing vs Looking** **_Proactive alerting_** — Traditional alerting has notified of up/down at the simplest level, and more recent apps notify of deviations off of the norm to clue in to potential issues before they become existing ones. The latest developments have revolved around combining smart alerting signals blended with preset remediations. Having the most common issues for each service monitored regularly for deviations from intelligently tracked performance coupled with a preloaded, automated remediation to address the issue — should it arise — is the way to scale cloud native infrastructure confidently. **_Modern Triage_** — Traditional triage has alerts that signal an issue or issues, followed by (certain) teams investigating from top down — website/app, the network, the underlying cloud or server/storage… Once an issue with an AZ, Data center, K8s cluster is identified, remedies can be made. This can take seconds, minutes, or unfortunately sometimes hours given the collaboration microservices brings. Having the collaboration happen as a “peace time” practice for preparation is good. Having it happen in context of preventing issues from ever happening is ideal and modern tools are allowing for this. **_Modern Remediation_** — Understanding the problem before there is a problem. Navigating cloud — native and µ-services based systems is a twisted set of paths through a web of dependencies to even understand which services you need to investigate and work with. With a ticking clock and management watching, this can be a stressful endeavor. Working through stacks of issues and presetting RunBook automation can be an ominous job. With modern RunBook automation you can have stacks of RunBooks prebuilt for your most common issues, probing for them before you have issues. Having a number of issues resolved before systems and services go down, zeroes out your KPIs for many incidents. No Time to Alert metrics, No Time to Root Cause metrics, and No Time to Resolution metrics because you caught and addressed them before they became \*major\* issues.. **_And better business_** — On top of slowdowns or in worst case outages, proactive automation and remediation extends to better business management. Help CloudOps eliminate under/over provisioning by rightsizing and optimizing your EKS, Cloud, and other critical services in similar preventative fashion to incident prevention. ## **Incident Response for Security** As much of Incident Response concerns security, there are six steps from SANS, a security software training organization, that occur in a cycle each time an incident occurs. There are 4 to 7 steps from other public and private organizations. Their steps are: - Preparation - Identification - Containment - Eradication - Recovery - Lessons learned Our focus at unSkript is to help you succeed with not only the automation but also the process and documentation to enable a proactive approach to incident response. The learnings from this effort will extend to your platform reliability approach, cloud cost management, and other tools and cost optimization efforts. Below are other lists below you might pursue. ## **NIST** What Does the NIST Incident Response Cycle Look Like? NIST’s incident response cycle has four overarching and interconnected stages: 1) preparation for a cybersecurity incident, 2) detection and analysis of a security incident, 3) containment, eradication, and recovery, and 4) post-incident analysis. In the next post we will share some of the vision leading RunBook builders, technologists, and investors see coming in the future of RunBook automation. Again, mindset shift, i.e. moving from coding to firefighting and back, is more time consuming and taxing than many SRE and DevOps let on, leading to decreased productivity and increased stress and burnout. Thanks for taking a look! **Schedule a** [**meeting**](https://calendly.com/abhisheksaxena/30min?month=2022-09) **to see how our new diagnostics check and automatically remediate based on failure readouts for your critical services — Kubernetes, AWS, Kafka, Elastic, and dozens more today.** **Or try our open source sequential checks and remediations on** [**GitHub**](https://github.com/unskript/Awesome-CloudOps-Automation)**.** Cover image by [Evelyn Simak](https://www.geograph.org.uk/profile/14840_) and licensed under [CC 2.0](https://creativecommons.org/licenses/by-sa/2.0/)

Part 1 — What is Incident Response, how does it work, and what do the best do?
Sep 28, 2023
This is the first in a three-part series designed to help you start or improve your incident response and runbook automation in your organization. Goals are to give you an unbiased framework for evaluating where you are, what leaders in the space are doing, and where things are going. This post specifically looks into the types of incident response, and how many organizations are handling this today. The more common incidents that require organized responses range from attacks on your business systems or IT networks, to theft or destruction of your data and intellectual property. These can be caused by internal or external factors, deliberately or unintentionally. Runbook automation, increasingly called “operations as code” reduces the resources, time, risk, and complexity of performing operations tasks and ensures consistent execution. You can take operations as code and automate operations activities by using event-based scheduling and triggers, and let them manage future occurrences ongoing. Through integration at the infrastructure level you avoid traditional “swivel chair” processes that require multiple interfaces and systems to complete a single operations activity. This “Mindset shift” is key to point out as it is more time consuming and difficult than many SRE and DevOps let on, leading to decreased productivity and increased stress and burnout. ## **Incident Response Processes** A key difference between various incident response processes is the type of triggers initiating a response. The first type of triggers are usually tangible with users already noticing performance issues, such as zero-day threats. The second type provides early warnings based on indirect indications of security compromise or system failure, and attempts to preempt issues before they impact the end-users — however, these triggers are more prone to false positives. These triggering approaches determine the main types of incident response processes: - **Front-loaded prevention** — collect performance intelligence data and indicators of system failure to prevent degradation or downtime early. This approach helps address issues and threats before they cause damage, but their higher rate of false positives can increase costs. Usually the higher number of false-positive responses is an accepted price to pay to protect critical apps and data. - **Back-loaded recovery** — collect data on visible threats and incidents, which may already have occurred. This approach minimizes false positives but does not stop failures or attacks early. It is unsuitable for critical infrastructure or high-stakes applications. - **Hybrid incident response** — combine front-loaded and back-loaded data processing to enable early detection and immediate/urgent response. This is a more comprehensive response strategy, and as such is a larger investment in organizational resources. A hybrid approach should emphasize prevention, with the back-loaded response reserved for non-critical components. Our point of view is proactive, automated response to security threats, infrastructure failures, or fat fingering is harder and more expensive, but builds speed, accuracy, and scalability into your team and organization. ## **How we see incident response being handled today** Playbooks, runbooks, wikis oh my. At a recent DevOpsDays event we had the privilege of talking to a hundred or so Dev, Eng, Security and Ops pros about how they handle incident response in their teams and orgs. The spectrum is eye opening. From literally no owners and process to very defined automation and protocols. The reasons why varied as well. From getting the point experts off (rough) on call schedules, to regulations, to management decisions. If I had to rank what we said, I would say Wikis or other shared documentation are the number one way incident response and platform reliability are being handled now. Task-based automation being the second way. (We will survey more formally and share results soon) **Wikis or basic process and documentation** - These scenarios are a great first step, and where most teams are in our estimation. - Some playbooks or runbooks are laid out in text, sometimes by specific incident categories, to help reduce MTTR on critical issues where downtime does occur. - This also serves to reduce tribal knowledge and dependence on SMEs, and/or to transition as teams change due to promotion/rotation, M&A, or simply turnover. **Piecemeal, Task-specific Automation with Human in the Loop** - The more advanced stage where more progressive teams have DIY’d open source or IT automation solutions to keep MTTR very low due to SLAs, to keep platforms reliable during code pushes, and/or multiple experts/teams on the same page(s). **Integrated Automation** - Leading SRE and DevOps teams have synthesized their processes for automated diagnosis and remediation to maintain very aggressive SLAs and minimize performance degradation, security incidents, and human error. - All especially important in organizations with frequent code pushes, and/or larger, more distributed teams, and more dependence on the apps and infrastructure for revenues. - Very advanced teams have incorporated this into their software development lifecycle. Running checks and remediating is the standard way of troubleshooting In the next post we will delve deeper into why tribal knowledge, Wikis, and basic automation aren’t enough by sharing some of the best practices we are seeing around runbook processes and their automation. Again, mindset shift, i.e. moving from coding to firefighting and back, is more time consuming and taxing than many SRE and DevOps let on, leading to decreased productivity and increased stress and burnout. Thanks for taking a look! \[/vc\_column\_text\]\[/vc\_column\]\[/vc\_row\]